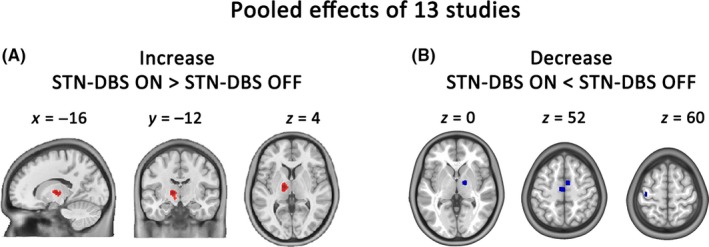
Figure 2.

ALE meta‐analysis of resting‐state PET/SPECT studies. (A) Brain areas showing increased activity caused by STN‐DBS. (B) Brain areas showing decreased activity caused by STN‐DBS. Coordinates are given in MNI space (Voxel‐wise threshold P < 0.001[uncorrected]; cluster‐level threshold P < 0.05 with 5000 permutations). GPi, globus pallidus internus; STN, subthalamic nucleus; THA, thalamus; SMA, supplementary motor area
