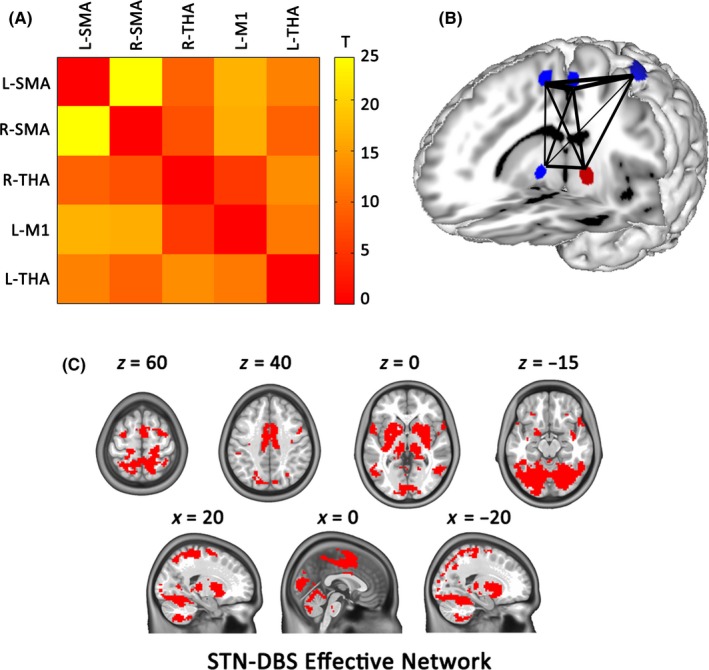
Figure 3.

Functional connectivity among the STN–DBS‐affected brain regions at rest. (A) The mean correlation matrices of five clusters obtained from the above meta‐analysis in the healthy subjects at rest. The color code indicates z‐transformed correlation coefficients between two clusters in each cell of the matrix. (B) Surface rendering visualizing the functional connectivity between clusters. Red clusters and green clusters represent brain regions with an increase and decrease in brain activity, respectively. Line thickness corresponds to the t scale. (C) Illustration of STN‐DBS effective network. THA, thalamus; SMA, supplementary motor area
