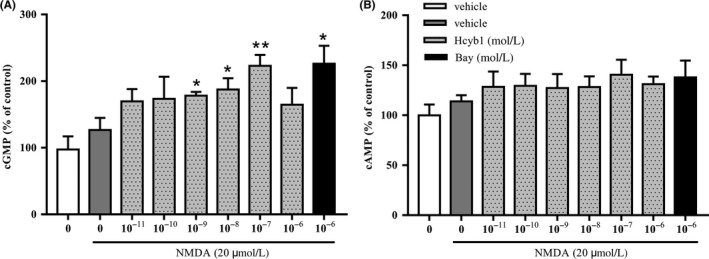
Figure 3.

The effects of Hcyb1 on cGMP (A) and cAMP (B) levels in HT‐22 cells after treatment for 10 minutes. The HT‐22 cells were treated with various concentrations of Hcyb1 for 10 minutes and stimulated with NMDA (20 μmol/L) for measurable cGMP and cAMP signal. Results are expressed as mean ± SEM (n = 6). *P < 0.05 and **P < 0.01 vs vehicle‐treated NMDA‐only group
