
Figure 8.
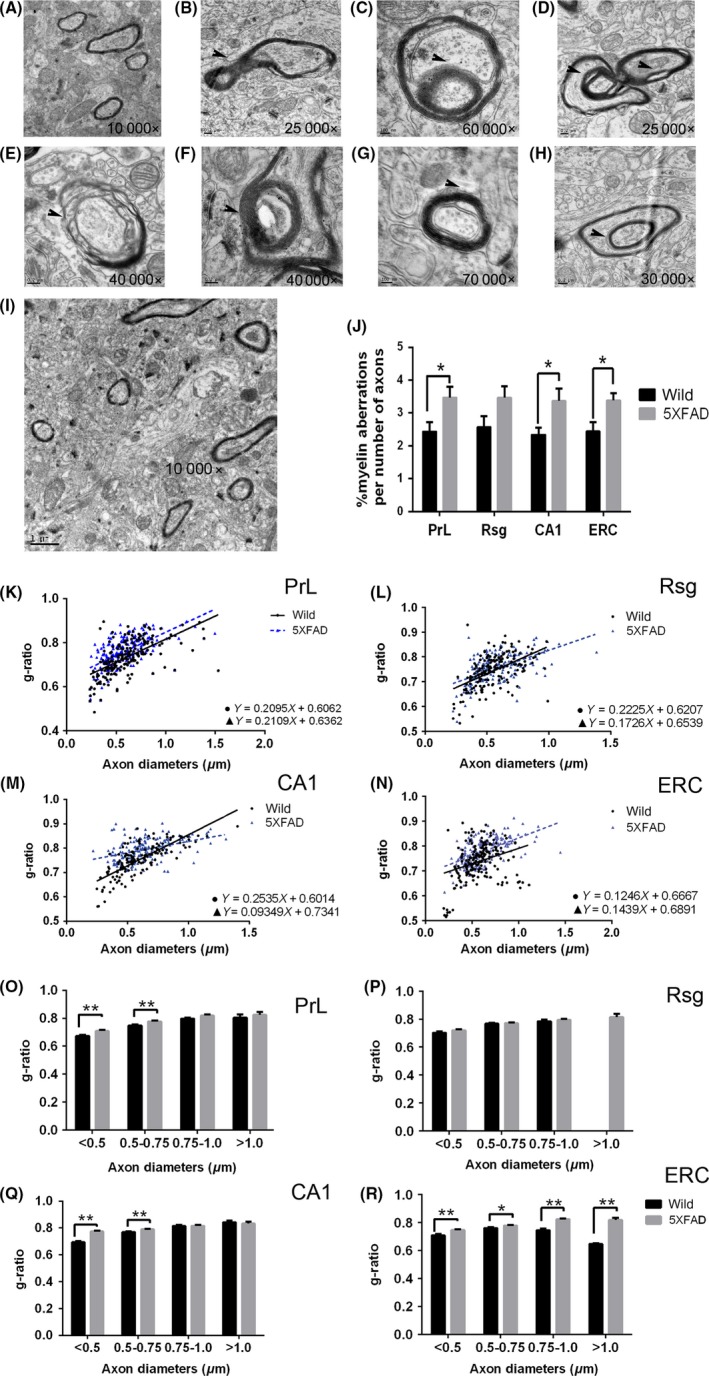
The change of ultrastructure in one‐month old 5XFAD mice with TEM. A‐H, The abnormal myelin ultrastructure was shown. I, The TEM image of CA1 of wild type at 1 mo old. J, The percentage of aberrant myelinated axons were increased significantly in PrL, CA1, and ERC. K‐N, Scatter plot of g‐ratio values in wild and 5XFAD mice in four regions. O‐R, The g‐ratio increased in PrL, CA1, and ERC. Scatter plot of g‐ratio values in wild and 5XFAD mice in four regions (D). (n = 2/group). *, P < 0.05, **, P < 0.005