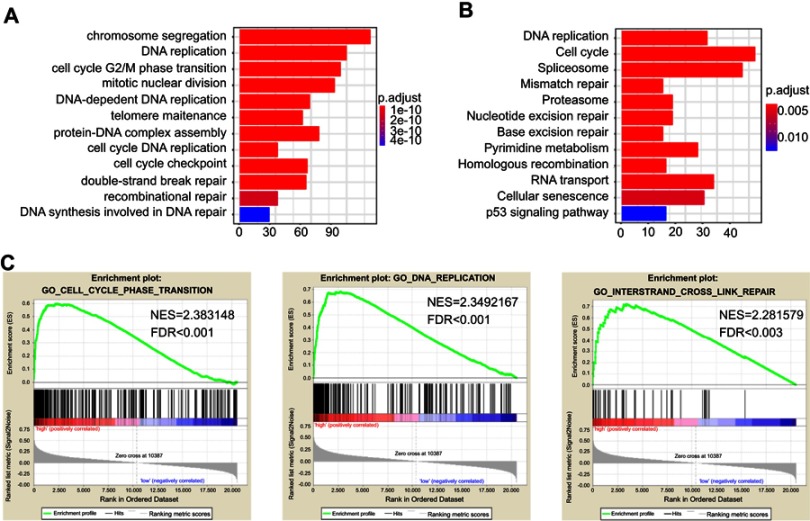
Figure 2.
The correlation between CDKN3 expression with the cell cycle and DNA damage repair. (A–B) GO (A) and KEGG (B) enrichment analysis with CDKN3 strongly correlated genes. The X axis represents counts. (C) Representative GSEA enriched gene sets within CDKN3 co-regulated genes.
Abbreviations: FDR, false discovery rate; NES, normalized enrichment score.

