
Figure 4.
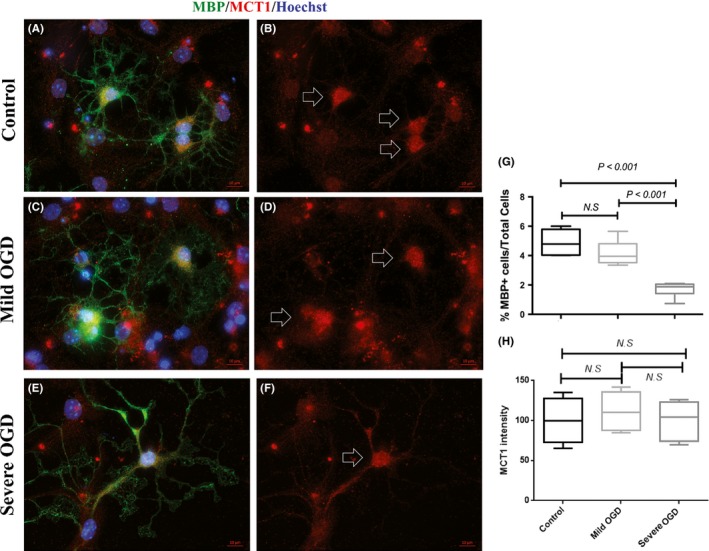
Effect of in vitro metabolic stress induced by oxygen‐glucose deprivations (OGD) on oligodendrocytes (OLs). Panels (A) (C) and (E) show representative microscopic images of OLs with MBP and monocarboxylate transporter 1 (MCT1) double immunofluorescent staining in control, mild OGD, and severe OGD groups, respectively. For a better display of MCT1 staining, Panels (B), (D) and (F) show the MCT1 labeling only. Signature MCT1 patterns are highlighted with arrows. Panel (G) shows the quantitative ratio of MBP+ OL count to total cell count (mean ± SD). Panel (H) shows the relative intensity of MCT1 in the control, mild OGD, and severe OGD groups. The experiment was performed in triplicate, and 30~50 images were taken for each coverslip. Scale bar = 10 μm