
Figure 6.
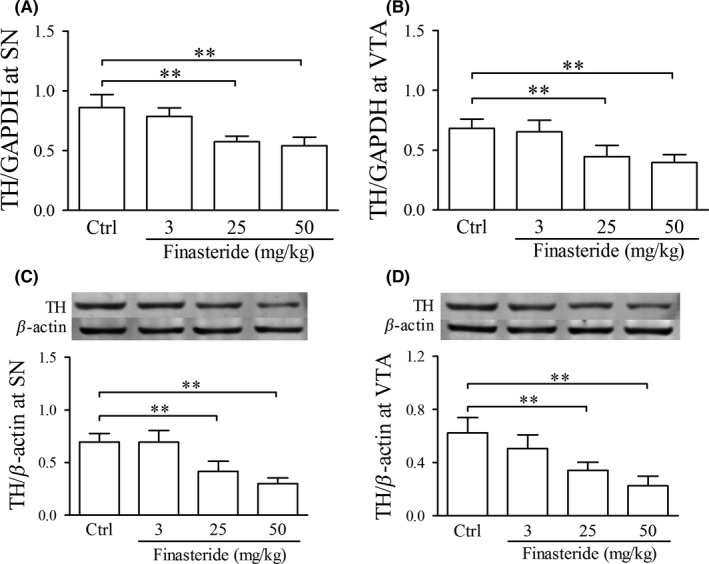
Real‐time quantitative RT‐PCR and western blot show the effect of finasteride on TH mRNA and protein expression, respectively, in adolescent rats. A and B are the relative expression of TH mRNA with the ratio of TH to GAPDH. In C and D, the upper panel is the immunoblot bands of TH and β‐actin, and the lower panels are the relative expression of TH with the density ratio of immunoblot bands of TH to β‐actin. **P < 0.01. It is shown that finasteride treatment at doses of 25 and 50 mg/kg significantly down‐regulated TH expression both at mRNA and protein levels in SN and VTA compared to control group. Abbreviations: TH, tyrosine hydroxylase; SN, substantia nigra; VTA, ventral tegmental area. (n = 7 for each group)