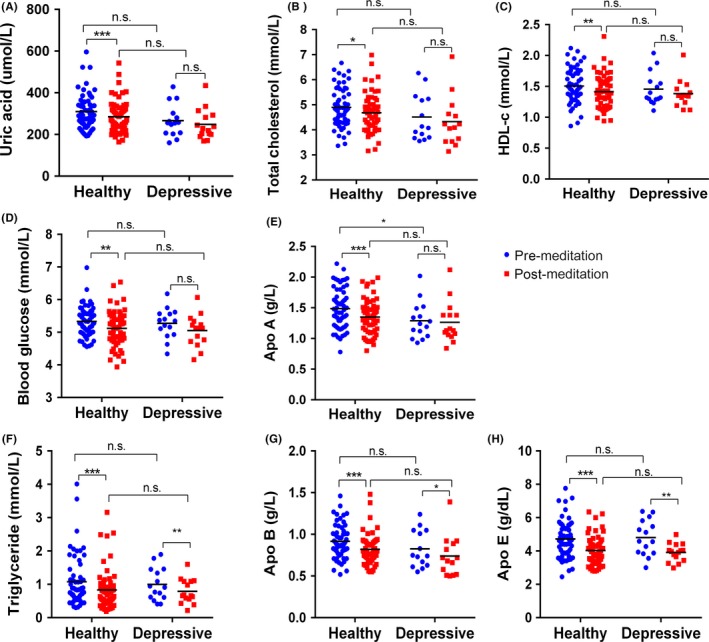
Figure 2.

Metabolic profiles pre‐ and postmeditation practice between two groups. Data are shown as mean ± SD. Statistical analysis was performed by repeated measures of ANOVA. Paired t test was further used to compare the mean difference between groups, ***P < 0.001 and **P < 0.01.
