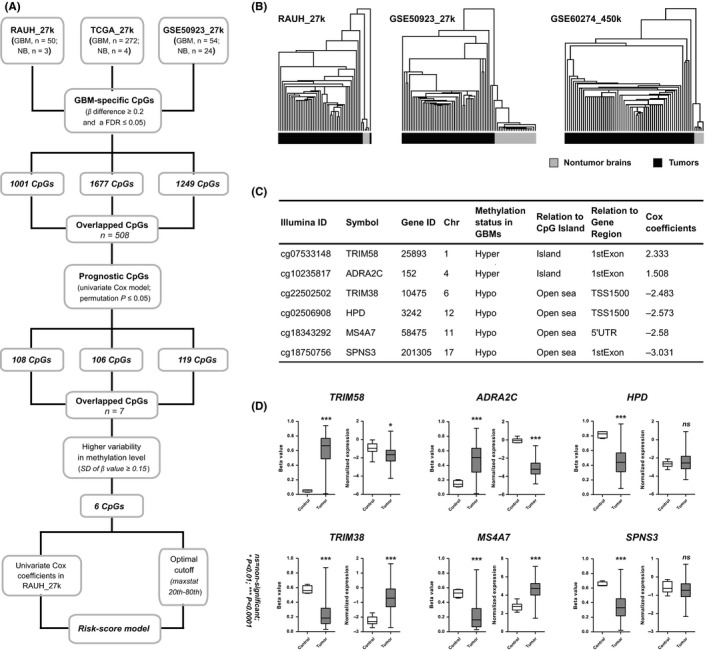
Figure 1.

The development of the six‐CpG prognostic signature; (A) the study workflow for the risk‐score signature construction; (B) hierarchical clustering on the 508 CpGs that were commonly identified in all the three discovery sets accurately distinguished GBMs from nontumor brain tissues in two discovery sets (RAUH_27k and GSE50923_27k) and an independent validation set (GSE60274_450k), with the similarity metric “Euclidean distance” and the clustering method “Centroid linkage”; TCGA_27k was not tested due to too few nontumor controls (n = 4) relative to the large number of GBMs (n = 282); (C) the characteristics of the six‐CpG panel; open sea loci refer to CpGs that are more than 4000 bp away from CpGs island; (D) the DNA methylation of the six CpGs and the expression levels of the relevant genes between GBMs (n = 279) and nontumor brain tissues (n = 10) from TCGA_27k; P‐values for Wilcoxon sum rank test and standard t test were, respectively, indicated for DNA methylation and expression data. *P < 0.01, ***P < 0.001, ns, nonsignificant
