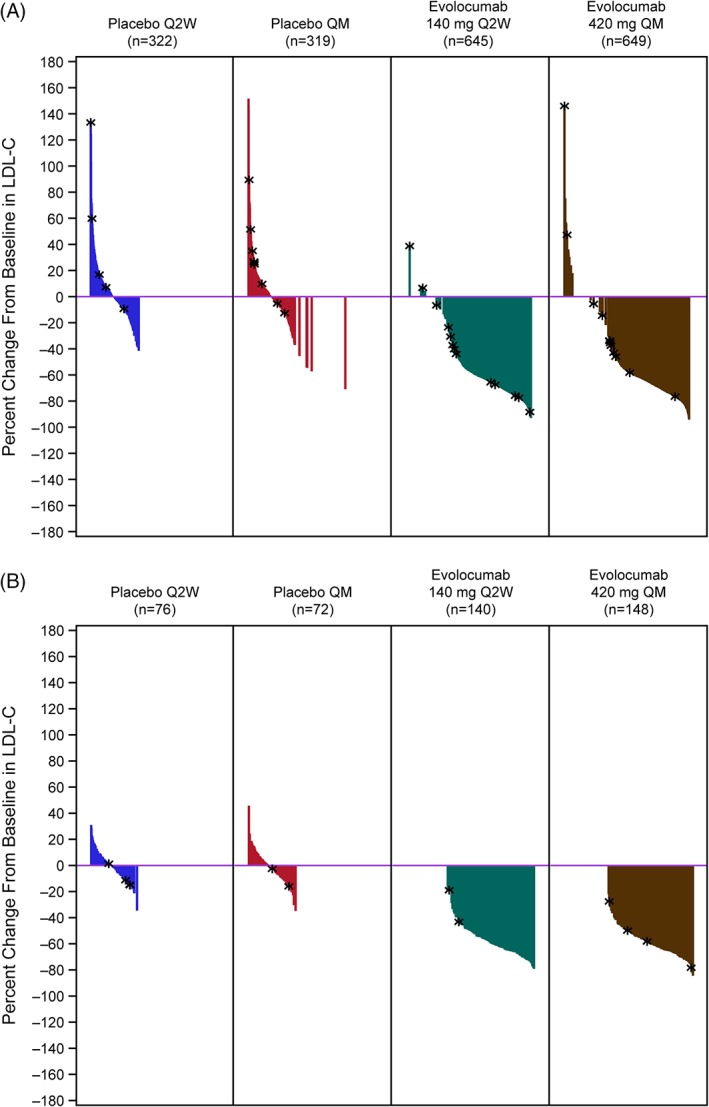
Figure 2.

Waterfall plots showing percent change from baseline in LDL‐C at the mean of weeks 10 and 12 in patients who did (A) and did not (B) receive combination statin therapy. Plot is based on observed data; no imputation is used for missing values. *patients with early termination. Abbreviations: LDL‐C, low‐density lipoprotein cholesterol; n, number of patients randomized, dosed and who were evaluable for LDL‐C at the timepoint; QM, monthly; Q2W, every 2 weeks
