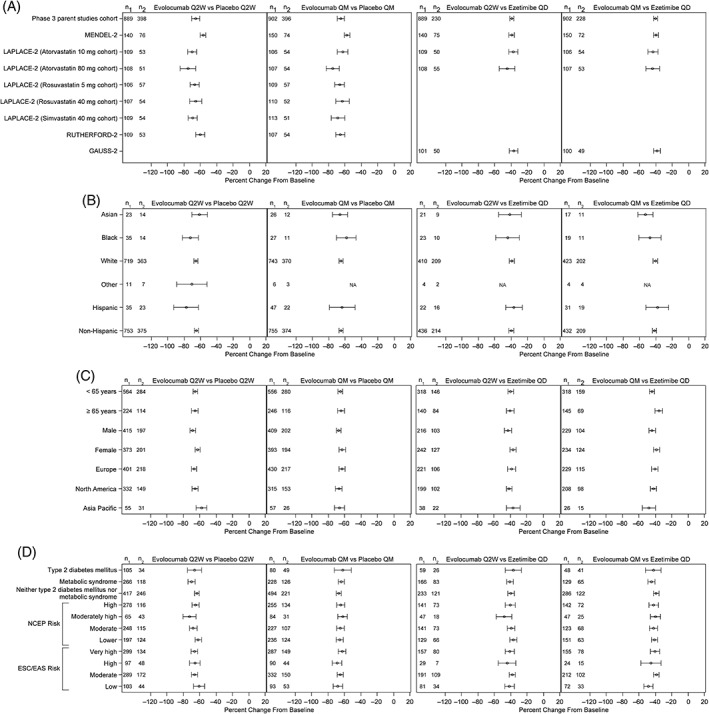
Figure 3.

Percent change from baseline in LDL‐C at mean of weeks 10 and 12 for evolocumab vs placebo or ezetimibe according to individual study (A), race (B), patient demographic characteristics (C), and disease status (D). Abbreviations: EAS, European atherosclerosis society; ESC, European Society of Cardiology; LDL‐C, low‐density lipoprotein cholesterol; NA, not applicable; NCEP, National Cholesterol Education Program; n1, number of patients in the subgroup of interest included in the repeated measures model receiving evolocumab; n2, number of patients in the subgroup of interest included in the repeated measures model receiving placebo; QD, daily; QM, monthly; Q2W, every 2 weeks
