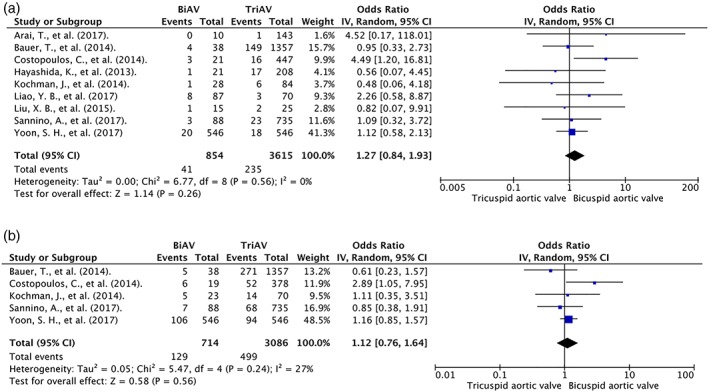
Figure 2.

Forest plot of included studies comparing (a) 30‐day mortality and (b) mid‐term mortality in patients with BAV and TAV. Horizontal lines represent the 95% CIs, with marker size reflecting the statistical weight of the study using random‐effects model. A diamond data marker represents the overall OR and 95% CI for the outcome of interest. Abbreviations: BiAV/BAV, bicuspid aortic valve; CI, confidence interval; df, degrees of freedom; OR, odds ratio; TriAV/TAV, tricuspid aortic valve
