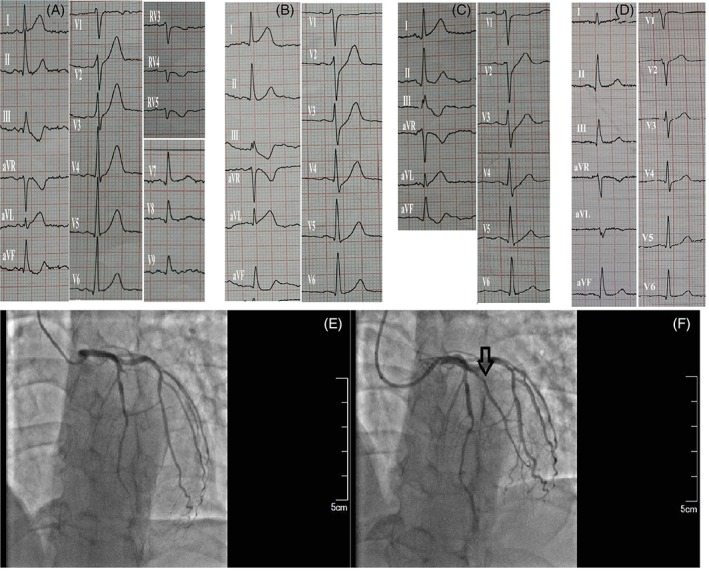
Figure 3.

Electrocardiographic and angiographic imaging of a 51‐year‐old male patient. A, At the first medical contact, an initial electrocardiogram (EKG) showed clinical signs of high lateral myocardial infarction for approximately 33 min. The ST‐segment was elevated in the I and aVL leads and a tall symmetric T wave was observed in leads V2‐V5. B, Ninety‐three minutes later, the de Winter EKG sign was observed in leads V2‐V5. E, Angiogram revealed a complete diagonal branch occlusion (arrow). D and F, Blood flow was restored after percutaneous transluminal coronary angioplasty (arrow) and the EKG changes resolved in leads V2‐V5
