Figure 3.

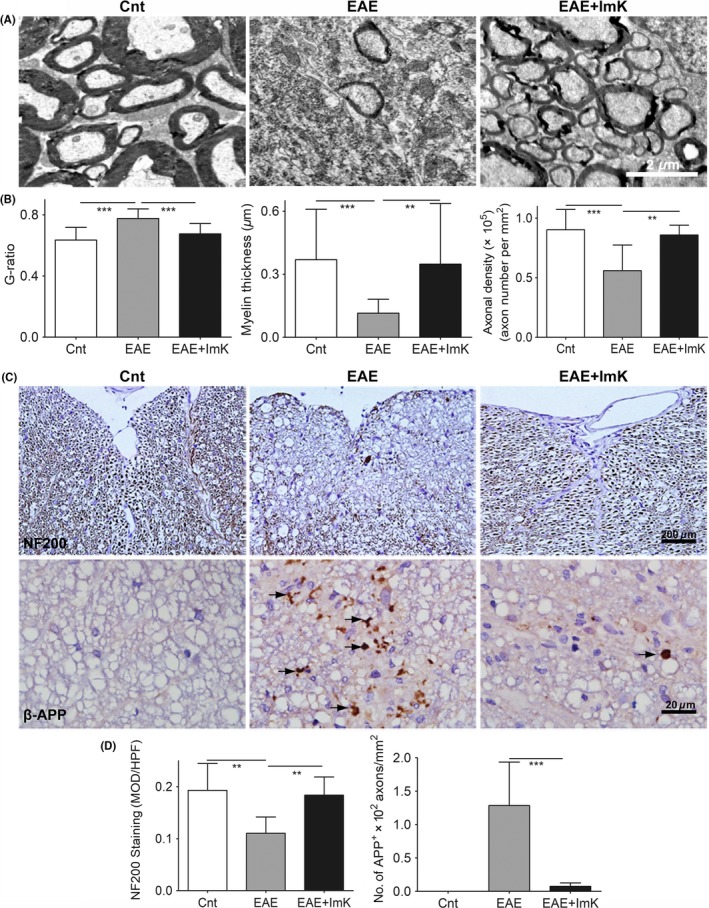
ImK preserves axon and myelin integrity. (A) Representative electron microscopy images illustrated axons and myelin in the lumbar spinal cord of each group. (B) The g‐ratio, axon diameter, and axonal density of each group were analyzed using Image‐Pro Plus software. (C) Immunostaining for NF200 and β‐APP in the white matter of lumbar spinal cord in Experimental autoimmune encephalomyelitis rats (arrows). (D) Quantification of the immunoreactivity in each group is shown (n = 6 for NF200, **P < 0.01; n = 8 for APP, ***P < 0.001). MOD: mean optical density
