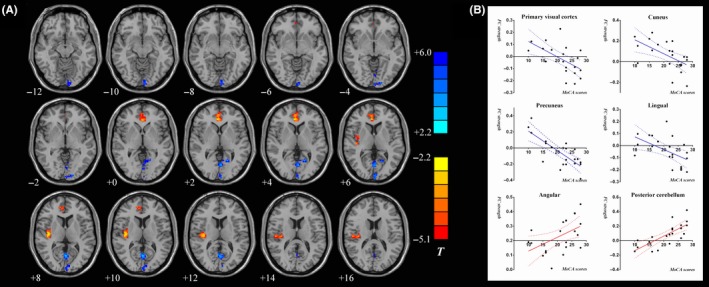
Figure 2.

Correlation analysis between the strength of FC in the PCC and the MoCA scores in the PD‐MCI group and the PD‐NCI group. A, Statistical parametric map showing the correlations analysis in the PD‐MCI group and the PD‐NCI group. Red and yellow areas represent regions showing significantly positive correlation between the PCC FC strength and MoCA scores. Blue and green regions indicate negative correlation between the PCC FC strength and MoCA scores. B, Pearson's correlation analysis results between the strength of FC in the PCC and the MoCA scores in PD‐NCI and PD‐MCI patients. The statistical significance threshold was set at P < 0.05
