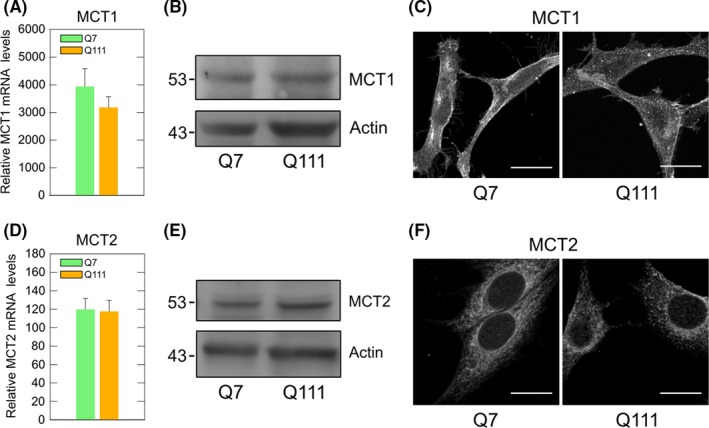
Figure 2.

Monocarboxylate transporter expression is unaltered in cellular models of Huntington's disease. (A,D) Real‐time qPCR analyses for MCT1 and MCT2 from mRNA obtained from Q7 and Q111 cells. The results were normalized using specific primers to amplify mRNAs coding for β‐actin. Student's t test, n = 3. (B,E) Western blot assay for MCT1 and MCT2 from total protein extracts of Q7 and Q111 cells. Results were normalized using a specific antibody for β‐actin. (C,F) Immunofluorescence analyses for MCT1 (green) and MCT2 (green) in Q7 and Q111 cells. Representative images of four independent experiments. Scale bar is 20 μm
