Figure 3.

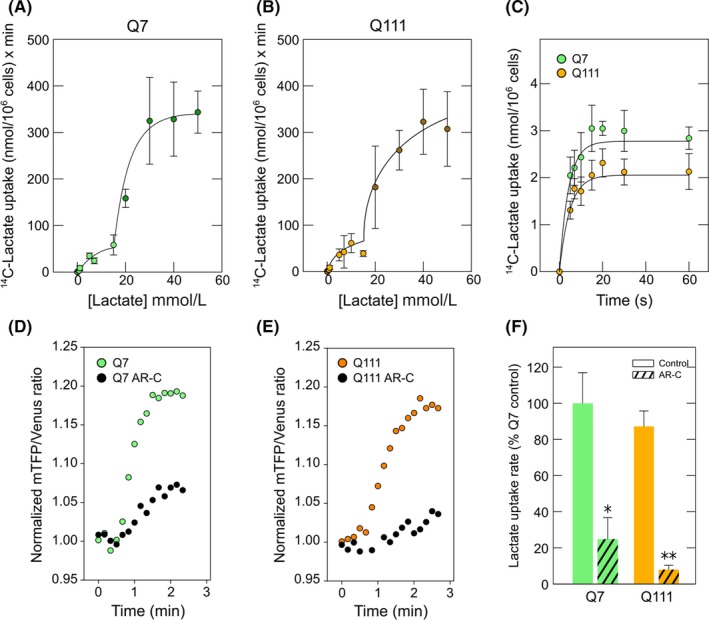
Kinetic properties of lactate transport revealed increased lactate transport efficiency in cellular models of Huntington's disease. (A) Dose‐response curve of 14C‐lactate transport in Q7 (10‐s uptake assay, 4°C). Double rectangular hyperbolas were fitted to the data using nonlinear regression, n = 3. (B) Dose‐response curve of 14C‐lactate uptake in Q111 (10‐s uptake assay, 4°C). Double rectangular hyperbolas were fitted to the data using nonlinear regression, n = 3. (C) Time course uptake for 14C‐lactate (0.1 mmol/L, 4°C) in Q cells. Simple exponential curve of two parameters was fitted to data using nonlinear regression (R > 0.99). (D) and (E) Time course of lactate uptake rate in cells expressing FRET‐based laconic sensor in the presence or absence of AR‐C155858 (AR‐C). Data correspond to a representative experiment in Q7 (D) and Q111 (E) cells. (F) Bar plots for lactate uptake rate in Q7 and Q111 cells expressing FRET‐based laconic sensor. The rate was obtained from the slope of mTFP/Venus ratio per minute during the application of 5 mmol/L lactate in the presence or absence of AR‐C155858 (AR‐C). Data represent the mean ± SD from 6 cells (Q7) and 13 cells (Q111) from 4 independent experiments. Student's t test, *P: 0.05, **P: 0.01
