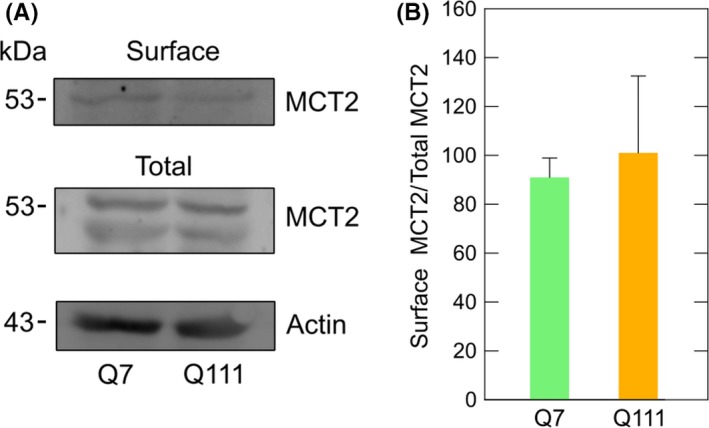
Figure 4.

Monocarboxylate transporter type‐2 expression at the cellular surface is not altered in cellular models of Huntington's disease. (A) Western blot analyses for MCT2 from biotinylated and total proteins from Q7 and Q111 cells. Results were normalized using a specific antibody for β‐actin in total protein extracts obtained from Q7 and Q111 cells. (B) Bar plots for densitometric scanning analysis of the MCT2 Western blot shown in A. Student's t test, n = 3
