Figure 6.

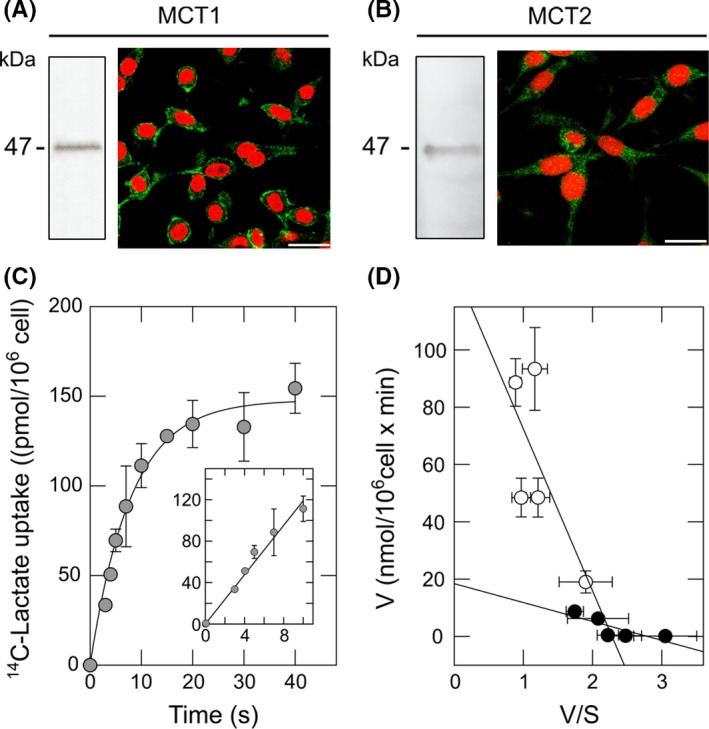
C6 cells express functional type‐1 and type‐2 monocarboxylate transporters. (A,B) Western blot and immunofluorescence analyses for MCT1 and MCT2 in C6 cells. Nuclei were stained using iodide propidium. Scale bar is 20 μm. (C) Time course uptake for 40 s and 10 s (inset) of 14C‐lactate (0.1 mmol/L, 4°C) in C6 cells. Simple exponential curve of two parameters was fitted to data using nonlinear regression (R > 0.99). (D) Eadie‐Hofstee plot for the dose‐response curve of 14C‐lactate transport in C6 cells (10‐s uptake assay, 4°C). Data represent the mean ± SD of four experiments. Lines were fitted using linear regression. Linear regressions were calculated using SigmaPlot v9.0 software (only correlations >0.9 were accepted)
