Figure 7.

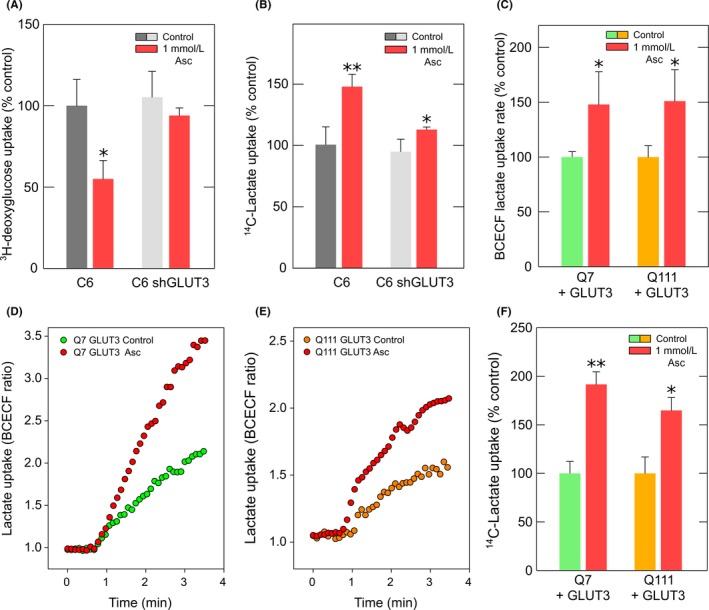
The modulation of lactate transport by ascorbic acid is dependent on GLUT3 expression. (A) Bar plot for the 3H‐deoxyglucose transport analysis using a 15‐s uptake assay (25°C) in C6 cells and shRNA‐treated C6 cells to knock down GLUT3 expression. Cells were treated with 0 mmol/L (control) or 1 mmol/L ascorbic acid prior the assay. The data represent the mean ± SD of four experiments. (B) 14C‐Lactate transport analysis using a 10‐s uptake assay (25°C) in C6 cells and shRNA‐treated C6 cells to knock down GLUT3 expression. Cells were treated with 0 mmol/L (control) or 1 mmol/L ascorbic acid prior the assay. The data represent the mean ± SD of three experiments. (C) Bar plots for the lactate uptake rate using a BCECF H+ probe in Q7 and Q111 cells expressing GLUT3‐mCherry. Cells were preloaded with 1 mmol/L ascorbic acid/0.1 mmol/L DTT (Asc) or 0.1 mmol/L DTT (control) for 60 min. The rate was obtained from the slope during the first 100 s after the application of 5 mmol/L lactate. Data represent the mean ± SD from 8 cells (Q7) and 6 cells (Q111). (D) and (E) Time course of lactate uptake rate using BCECF H+ probe in Q7 (D) and Q111 (E) cells expressing GLUT3‐mCherry. Cells were preloaded with 1 mmol/L ascorbic acid/0.1 mmol/L DTT (Asc) or 0.1 mmol/L DTT (control) for 60 min. Data correspond to a representative experiment. (F) Bar plot of the 14C‐lactate transport analysis using a 10‐s uptake assay (25°C) in Q7 and Q111 cells overexpressing GLUT3‐EGFP. Cells were treated with 0 mmol/L (control) or 1 mmol/L ascorbic acid prior to the assay. The data represent the mean ± SD of three experiments. ANOVA followed by Bonferroni, **P < 0.01, *P < 0.05
