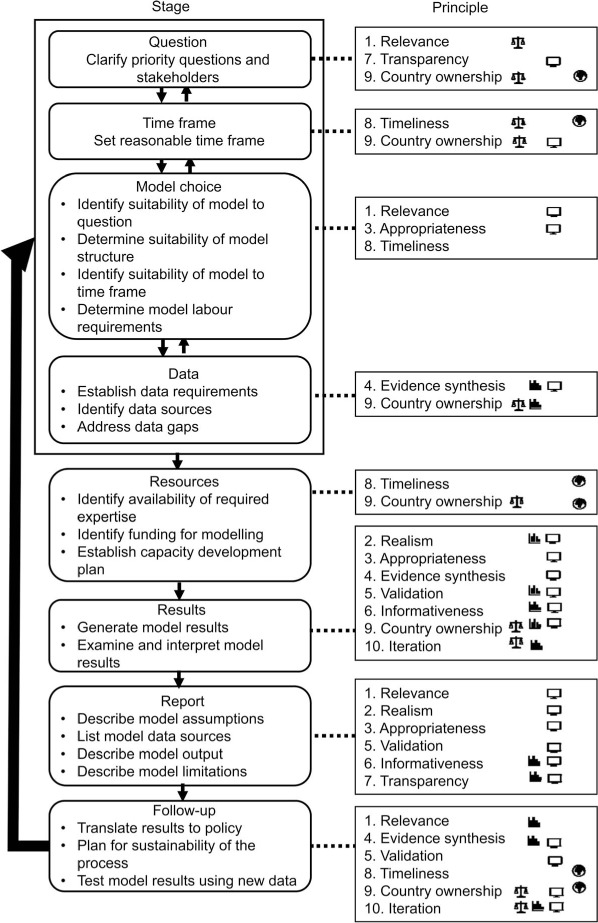
Figure.

Flow chart of steps involved in a typical modelling project*. * Numbers refer to principles described in the text. Icons shown on right of the figure describe suggested lead actors for each step in the modelling process, i.e., the individual or group primarily responsible for implementing principles from a given practice. Actors include in-country decision makers (
 ), in-country experts (
 ), modellers (
 ) and international funders (
 ). Other actors may also have a role in contributing towards activities or in creating the demand for them.
