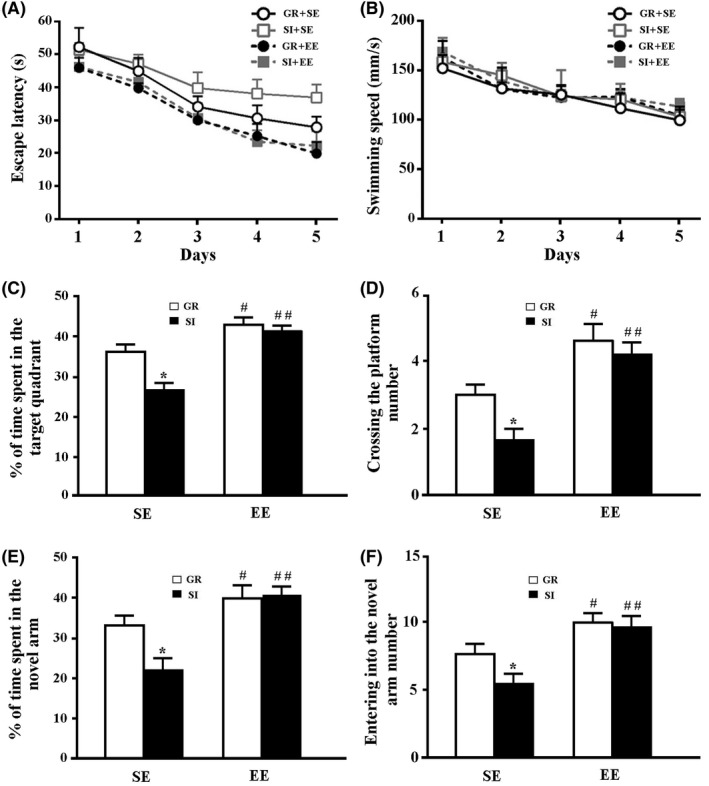
Figure 1.

The behavioral analyses. (A) The mean escape latency during the MWM training period. (B) Swimming speed. (C) The percentage of time spent in the target quadrant in the probe test. (D) The number of platform area crossing. (E) The percentage of time spent in the novel arm in the Y‐maze test. (F) The number of entries into the novel arm. Data represent mean±SEM from 8 mice per group. Data in Figure 1A,B were analyzed by repeated‐measures ANOVA. *P < 0.05. Data in other figures were analyzed by ANOVA with post hoc Student‐Newman‐Keuls test. *P < 0.05, GR vs SI; #P < 0.05, ##P < 0.01, EE vs SE
