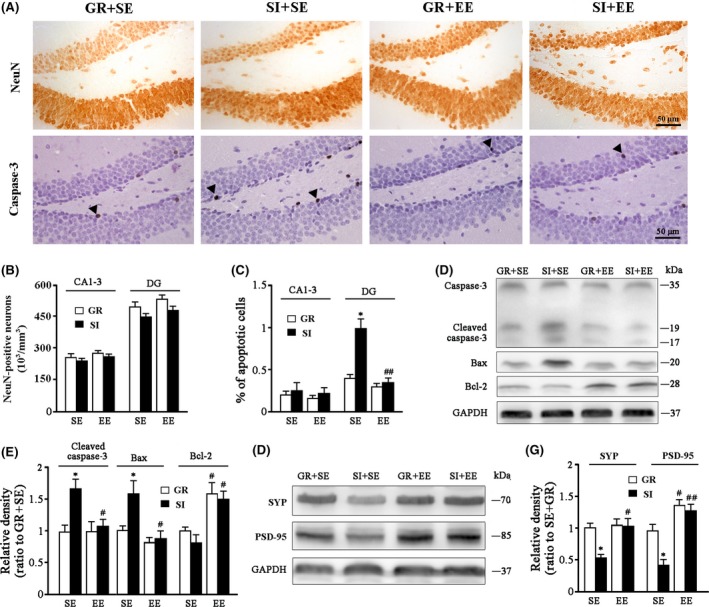
Figure 2.

Analyses of cellular apoptosis and synaptic protein expression in the hippocampus. (A) Immunohistochemical staining for NeuN (upper panel) and caspase‐3 (lower panel) in the hippocampus. Arrowheads show caspase‐3–positive apoptotic cells. (B) NeuN‐positive neuronal count in the CA1‐3 and DG. (C) The percentage of apoptotic cells in the CA1‐3 and DG. (D,E) Representative bands of Western blot and densitometry analysis of cleaved caspase‐3, Bax, and Bcl‐2 protein levels. (F,G) Representative bands of Western blot and densitometry analysis of SYP and PSD‐95 protein levels. Data represent mean ± SEM from 4 mice per group. The statistical analysis was performed by ANOVA with post hoc Student‐Newman‐Keuls test. *P < 0.05, GR vs SI; #P < 0.05, ##P < 0.01, EE vs SE
