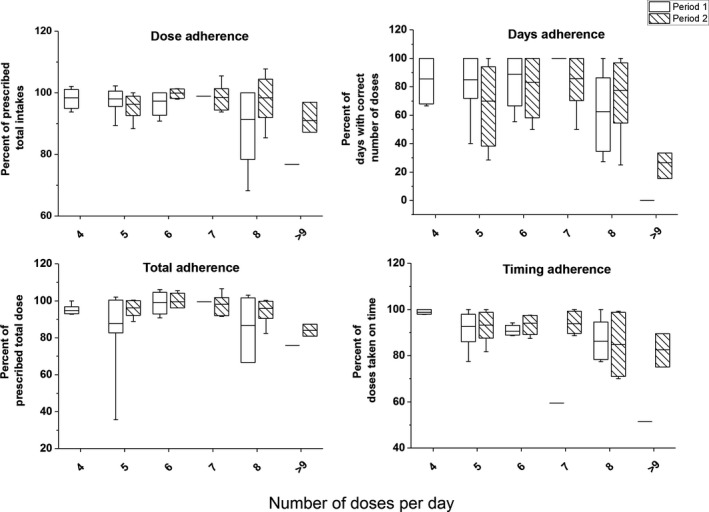
Figure 2.

Total, days, timing, and dose adherence by number of prescribed doses per day in periods 1 and 2. The horizontal line in each box represents the mean adherence. The 25th and 75th percentiles of adherence are indicated by the box, and the range is indicated by the whiskers
