
Figure 2.
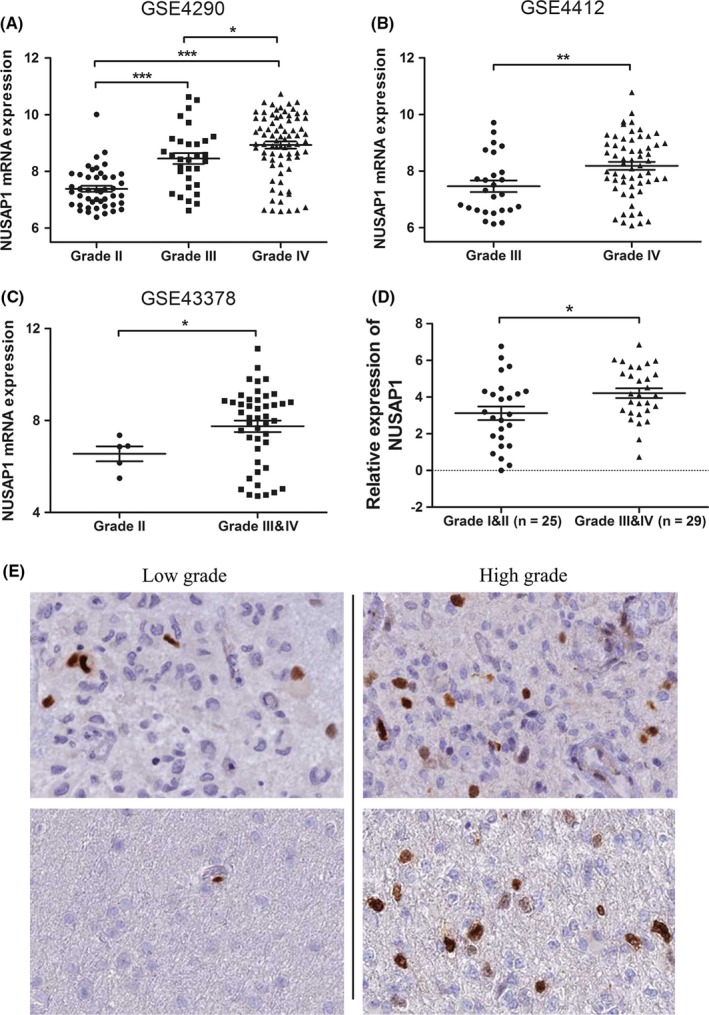
NUSAP1 expression is correlated with glioma grade. A‐C, Increased expression of NUSAP1 was detected with pathological grade rising, based on analyses of data from GSE4290 (A), GSE4412 (B), and GSE43378 (C). (D) Quantitative RT‐PCR analysis of NUSAP1 mRNA expression in 25 low‐grade and 29 high‐grade glioma tissues. NUSAP1 expression was normalized to the level of β‐actin. Data are presented as ‐∆∆Ct. (E) NUSAP1 protein expression in low‐grade and high‐grade glioma. Images were taken from the human protein atlas (http://www.proteinatlas.org). *P < 0.05, **P < 0.01, ***P < 0.001