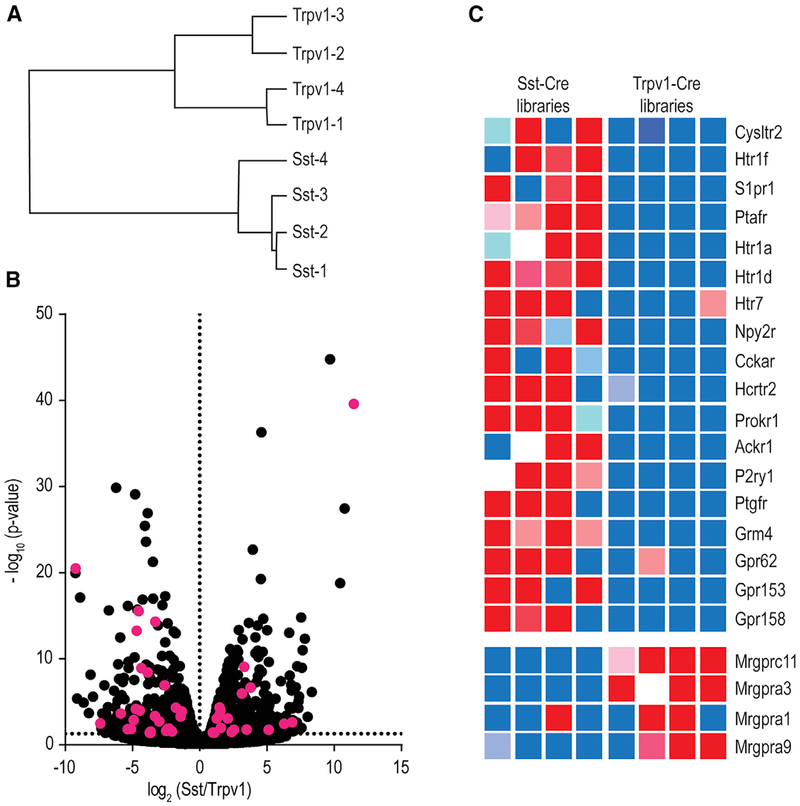
Figure 2. Identification of Potential Itch Receptors Expressed in Nppb Neurons.
(A) Dendrogram of the hierarchical clustering of gene expression between four Sst- and four Trpv1-cDNA libraries shows that the largest determinant for clustering is cell type.
(B) Volcano plot comparing gene expression between Sst- and Trpv1-cDNA libraries. The likelihood of a significant expression difference was assessed with EdgeR and accepted at p < 0.05 (a complete listing of differentially expressed genes is presented in Table S1). GPCRs in the group of significantly expressed genes are highlighted in magenta.
(C) Heatmap displays the relative gene expression in each cDNA library of some of these GPCRs.

