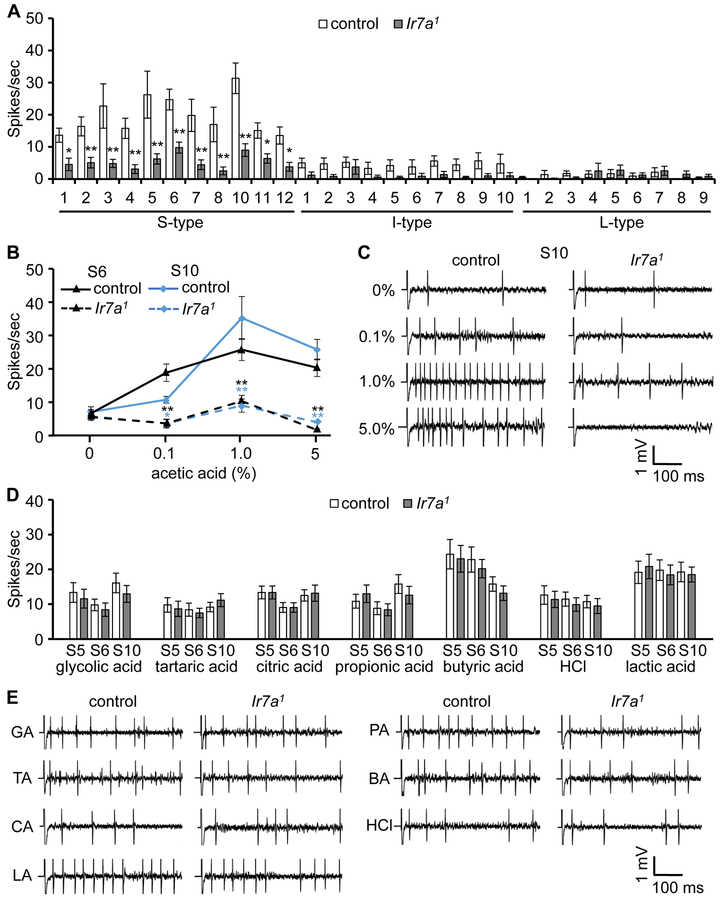
Figure 2. Action potentials induced by acetic acid depend on Ir7a.
Tip recordings performed on gustatory sensilla from labella of control (w1118) and Ir7a1 flies.
(A)A verage spikes produced by GRNs in S, I and L type sensilla in response to 1% acetic acid. n=15-18.
(B) Responses of S6 and S10 sensilla to the indicated concentrations of acetic acid. n=15-16.
(C) Representative traces obtained from S10 in response to the indicated concentrations of acetic acid.
(D) Frequencies of action potentials elicited from S5, S6, and S10 sensilla using 1% glycolic acid, 1% tartaric acid, 5% citric acid, 1% propionic acid, 1% butyric acid, 10 mM HCl, and 20% lactic acid. n=20.
(E) Representative traces on S10 sensilla in response to 1% glycolic acid (GA), 1% tartaric acid (TA), 5% citric acid (CA), 1% propionic acid (PA), 1% butyric acid (BA), 10 mM HCl, and 20% lactic acid (LA).
The error bars represent SEMs. The asterisks indicate significant differences from the controls (*p < 0.05, **p<0.01). Each frequency of the same sensillum between control and Ir7a1 mutant was compared using unpaired Student t-test.

