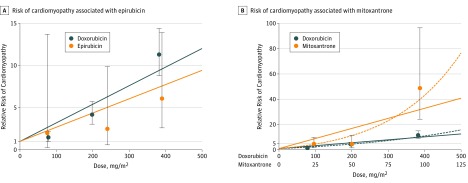
Figure. Risk of Cardiomyopathy Associated With Epirubicin (A) and With Mitoxantrone (B) Relative to Doxorubicin.
The circles (and extending 95% CI error bars) for each agent represent estimates from the Cox proportional hazards model based on categorical dose increments. Each circle is placed at the median dose on the x-axis for each category. Lines represent the linear (solid) and linear exponential (dashed, panel B only) modeled continuous dose-response relationships.

