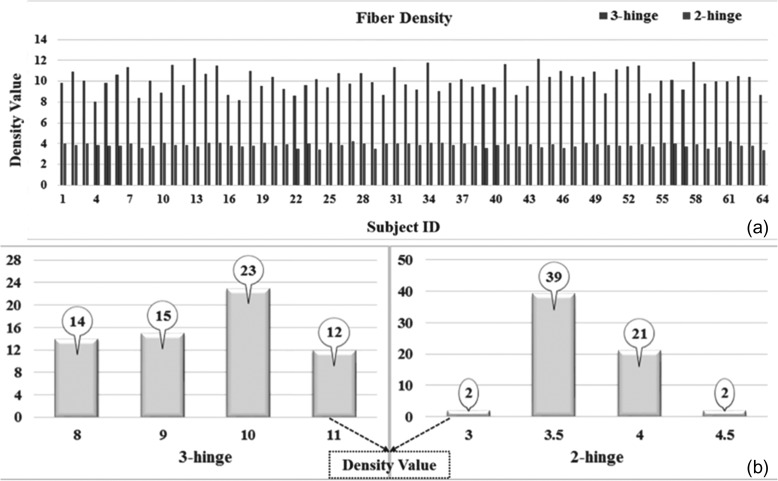
Figure 4.
(a) The average fiber densities on 2 hinges and 3 hinges within the group of 64 human brains; 3 hinges: left bar, 2 hinges: right bar. (b) 2-hinge and 3-hinge fiber density distributions within the group of 64 human brains. The number of subjects in each range is denoted in the circle with an arrow.

