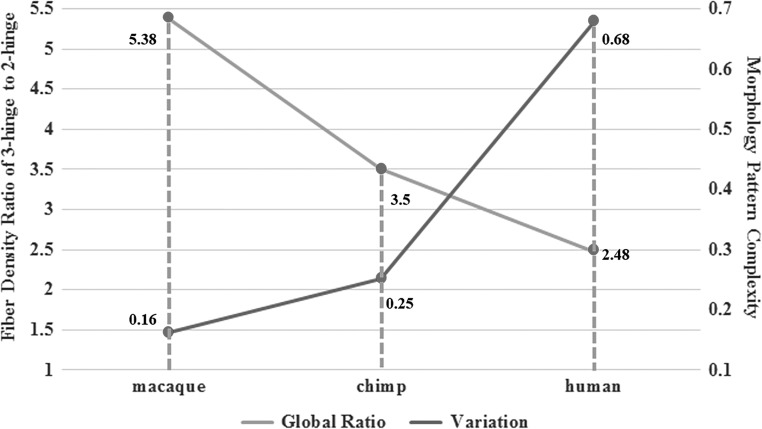
Figure 5.
Inverse correlation between average fiber density ratio of 3-hinge to 2-hinge gyri and average morphology complexity in macaque, chimpanzee, and human brains. The light gray line is the global fiber density ratio that refers to the vertical axis on the left, and the dark gray line is the morphology complexity that refers to the vertical axis on the right.

