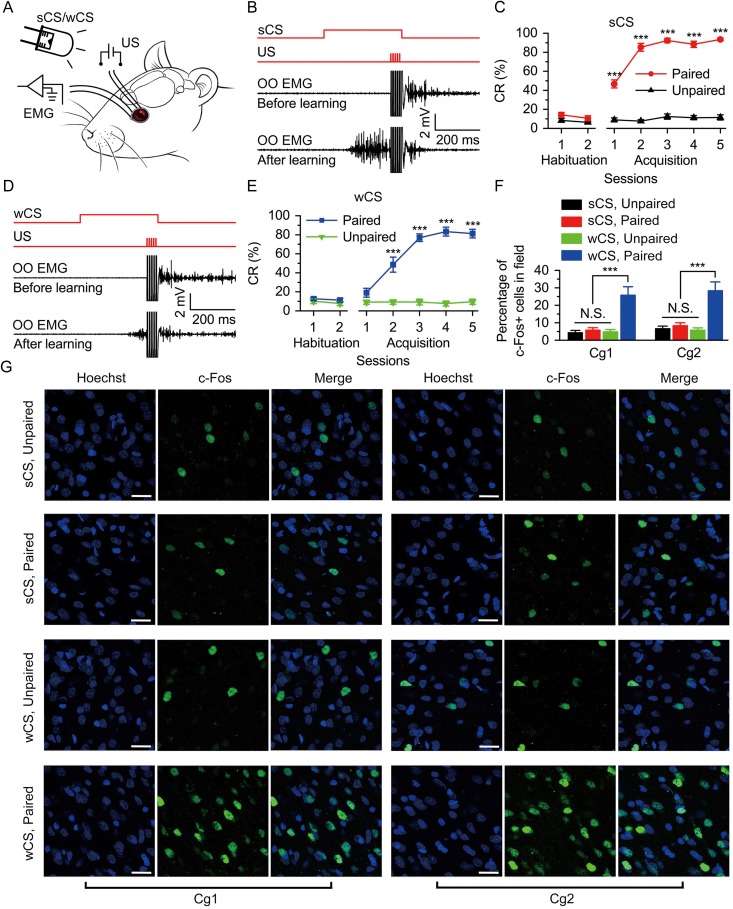
Figure 1.
The DEC was supported by both strong CS (sCS) and wCS and the level of c-Fos expression in Cg1 and Cg2 after the last acquisition training. (A) Behavioral diagram. For DEC, 2 levels of peripheral light (i.e., 500 nW/mm2 or 0.5 nW/mm2) were presented, as sCS and wCS, and 4 electrodes were implanted in the upper left eyelid, 2 for electrical stimulation as the US and the other 2 for recording the EMG activity of the OO muscle. (B,D) Upper panel: The conditioning paradigm illustrating the timing of the CS and the US. Middle and lower panels: Representative OO EMG before and after learning with the sCS (B) or wCS (D). (C,E) Evolution of percentage of conditioned response (CR%) for the sCS (C) or wCS (E) across 2 habituation and 5 acquisition sessions (C: n = 10 sCS, paired, n = 12 sCS, unpaired; E: n = 9 wCS, paired, n = 11 wCS, unpaired; ***P < 0.001; 2-way analysis of variance (ANOVA) with repeated measures followed by Tukey post hoc test). (F) The percentage of c-Fos-positive cells in Cg1 and Cg2 of 4 groups after the last acquisition training (n = 6 each; N.S., not significant, ***P < 0.001; 1-way ANOVA followed by Tukey post hoc test). (G) Representative images of Cg1 and Cg2 following last acquisition training are shown. Scale bars, 20 μm. Data are represented as mean ± standard error of the mean (s.e.m.).

