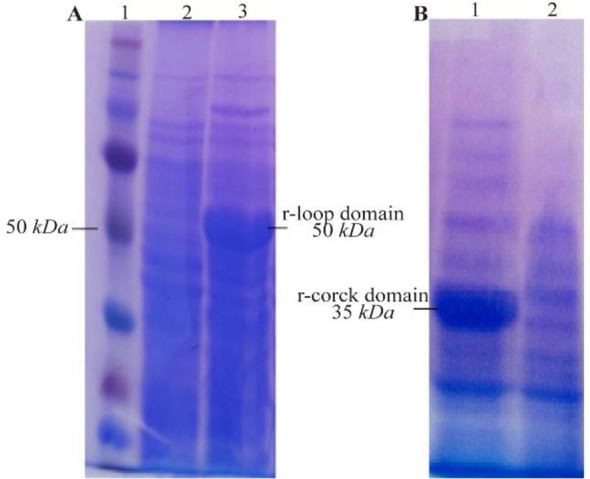
Figure 2.

SD-PAGE analysis of the recombinant, A) loop and, B) cork domain expression. A) Lane 1: standard protein molecular weight marker, Lane 2: un-induced control, Lane 3: expression of recombinant loop domain induced with 1 mM IPTG, B) Lane 1: un-induced control, Lane 2: expression of recombinant cork domain.
