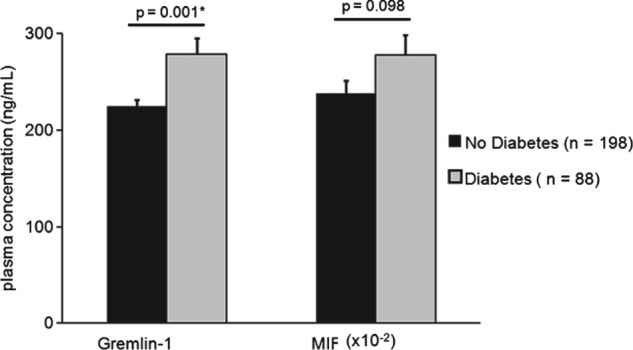
Figure 1.

Plasma levels of Gremlin‐1 and MIF and Gremlin‐1/MIF plasma ratio in diabetic and nondiabetic patients. The t test was performed for comparison of the 2 groups. Values are presented as mean ± SEM. A P value ≤0.05 was considered significant. Abbreviations: MIF, macrophage migration inhibitory factor; SEM, standard error of the mean.
