
Figure 1.
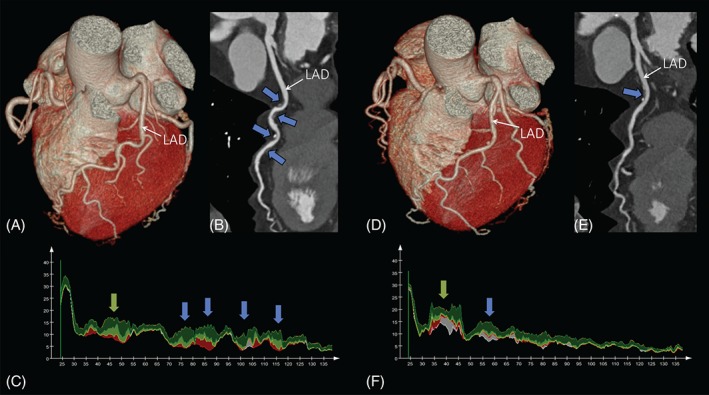
Coronary CTA images of a 58‐year‐old female monozygotic twin pair. Volume rendered reformations of the heart (A, D) of twin A and twin B, respectively. Curved multiplanar reconstructions (B, E). The blue arrows indicate coronary atherosclerotic plaques. The graphs on (C) and (F) illustrate the areas of different plaque components of twin A and twin B, respectively. The lipid‐rich (low‐CT attenuation) plaque components are shown in red. Fibro‐fatty tissue is shown in light green. Fibrous tissue is shown in dark green. Calcium is shown in white. The blue arrows indicate the corresponding plaques to panels B and E, whereas the green arrows indicate plaques that are not visible on panels B and E due to the viewing direction on the vessel. Abbreviations: CT, computed tomography; CTA, computed tomography angiography; LAD, left anterior descending artery.