
Figure 3.
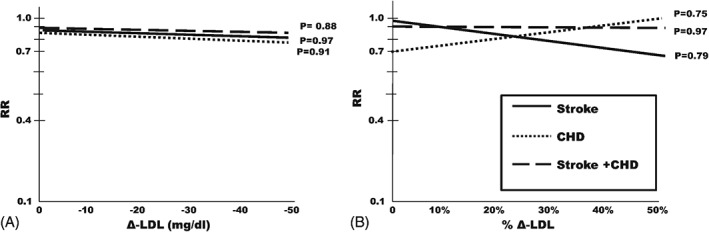
Relationships of (A) primary outcome reductions to the extent of LDL‐C reductions. Meta‐regressions of risk ratios on absolute LDL‐C differences (active treatment group minus placebo or less active treatment group). Relationships of (B) outcome reductions to percentage LDL reductions. The meta‐regressions of (A) are calculated on percentage LDL‐C differences (LDL‐C difference as percentage of on‐treatment LDL‐C in the control group). Regressions relative to stroke are in continuous lines; CHD, in dotted lines; composite of stroke and CHD, in dashed lines. Abbreviations: CHD, coronary heart disease; Δ‐LDL, LDL‐C difference; LDL‐C, low‐density lipoprotein cholesterol; RR, risk ratio.