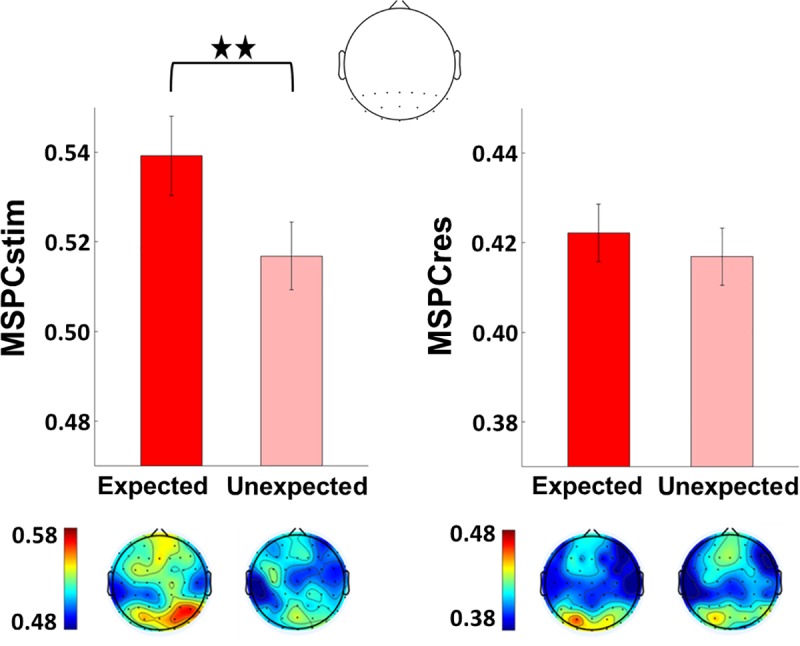
Fig 3. Expectation modulates MSPCstim but not MSPCres.

MSPC averaged across the two second-order IM components (f1 + f2 and f1 − f2) in the expected and the unexpected conditions. Results are shown for a posterior ROI (17 electrodes, top) and the scalp topographies (bottom). Error bars represent standard error across subjects (N = 15). The MSPCstim measure (left) quantifies IM responses by examining the degree to which the IM phase is driven by the phases of SWIFT and SSVEP stimulus (image) modulation. Conversely, the MSPCres measure (right) examines the degree to which the IM phase is driven by the tagged SWIFT and SSVEP neural response phases. These measures are therefore suggested to indicate signal integration occurring at earlier and at later stages of cortical processing, respectively. MSPCstim (left) was higher for the PV (expected) trials compared to the IR (unexpected) trials (χ2 = 22.9, P < 0.001), indicating increased neural integration between the SWIFT and SSVEP signals when stimuli are expected. This effect was not evident for the MSPCres measure (χ2 = 1.36, P > 0.05). The data underlying this figure is available in FigShare at DOI: 10.26180/5b9abfe5687e3. IM, intermodulation; MSPCres, multispectral phase coherency (response); MSPCstim, MSPC (stimulus); SSVEP, steady-state visual evoked potentials; SWIFT, semantic wavelet-induced frequency-tagging.
