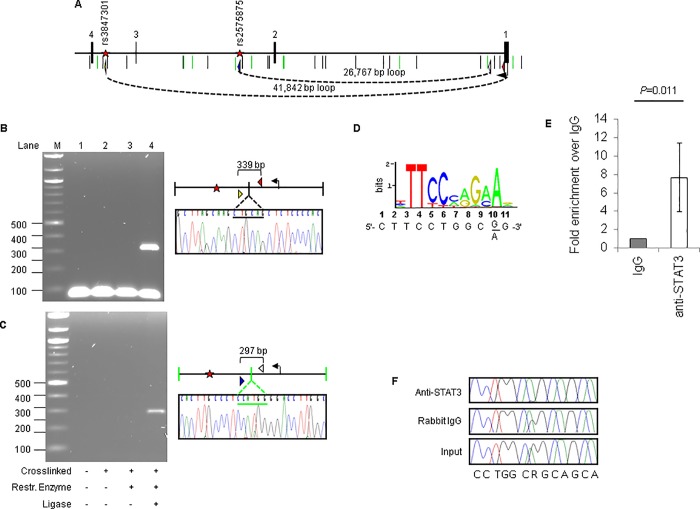
Fig 2. Chromatin interactions between eSNPs and the ABCA1 promoter.
(A) The region containing the first 4 exons of ABCA1. Black and green vertical lines depict PstI and NcoI sites respectively. The location of the eSNPs are shown as red stars. Primers used to detect 3C interactions are showed as colored triangles with the apex indicating direction of amplification. Possible chromatin loops between eSNPs and ABCA1 promoter are indicated by dash lines and the distances between the 2 restriction fragments. (B) 3C interactions between ABCA1 promoter and eSNP rs3847301. Negative controls (experiments performed without cross-linked DNA, restriction enzyme or ligase) are also shown. 3C product is confirmed by Sanger sequencing. PstI site is indicated by black underline. Transcription start site is indicated by a horizontal arrow. (C) 3C interactions between ABCA1 promoter and eSNP rs2575875. NcoI site is indicated by green underline. (D) The A allele of eSNP rs2575875 create a predicted STAT3 binding site, as shown by position weight matrix of STAT3 (JASPAR). Sequence flanking the SNP is shown below the weight matrix. (E) Quantitative PCR following chromatin immunoprecipitation with anti-STAT3 antibody in HepG2 cells showing an 8-fold enrichment of the sequence containing rs2575875. (F) Allele-specific enrichment of rs2575875 A allele is demonstrated by sequencing HepG2 DNA before treating cells with anti-STAT3 antibody (input, showing that HepG2 is normally heterozygous A/G at this site), with a control antibody (rabbit IgG) and with anti-STAT3. DNA recovered following ChIP with anti-STAT3 contains almost exclusively the A is allele.

