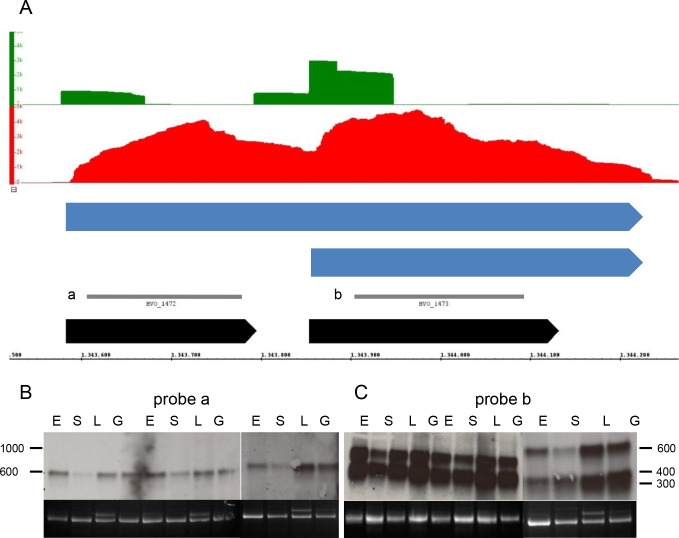
Fig 5. Analysis of two genes with a bicistronic and a monocistronic transcript.
A. Screenshot from the Integrated Genome Browser. For explanations of panels see Fig 2. In addition, the localization of the two probes a and b is indicated (grey). B. Northern blot analysis with probe a. C. Northern blot analysis with probe b. A different slightly agarose concentration was used for the third gel in B and C.

