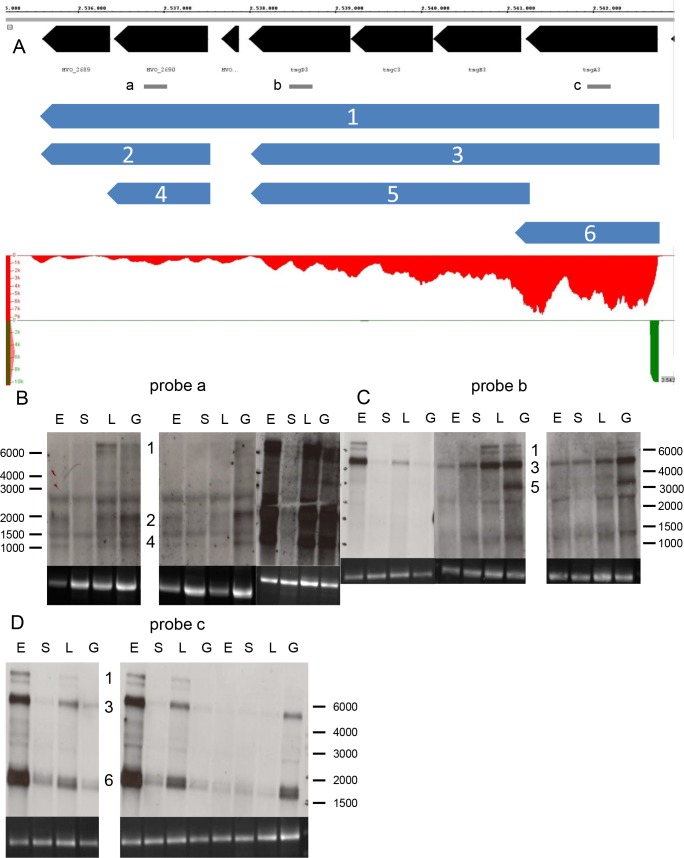
Fig 6. Analysis of a complex gene cluster of seven genes.
A. Screenshot from the Integrated Genome Browser. For explanations of panels see Fig 2. In addition, the localization of the three probes a, b, and c is indicated (grey). B. Northern blot analysis with probe a. C. Northern blot analysis with probe b. D. Northern blot analysis with probe c. The numbers of the transcripts shown in the overview (A) are shown alongside the respective bands in the Northern blots in B–D.

