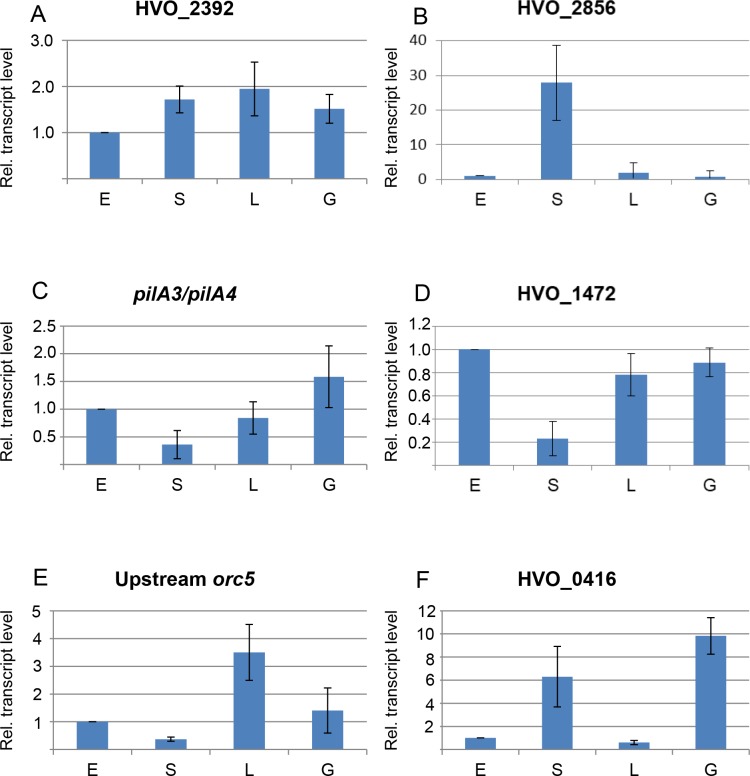
Fig 7. Quantification of transcript levels.
The Northern blots were scanned and the signals were quantified with ImageJ. The signals of the four conditions were normalized to the signals of RNAs from exponentially growing cells under optimal conditions (condition E). Average values of three biological replicates and standard deviations are shown. The respective gene designations are shown on the top of each panel.

