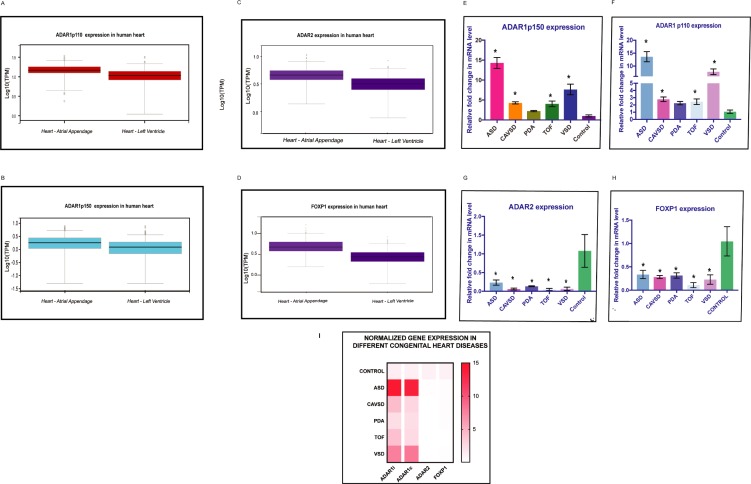
Fig 2. Heart defect-specific function.
(A& B) ADAR1 p110 and ADAR1 p150 showed higher expression in the atrial appendage than in the left ventricle. The Y-axis represented the log10 of the transcript per million (TPM) value. The expression of ADAR1 p150 (log10TPM 0.5) is lower in heart atrium as compared to ADARp110 (log10TPM 1.0). The whiskers represent the maximum and minimum values. The median is represented as a black line in the box. This indicated that ADAR1 isoforms express strongly in the heart atrium as compared to ventricles. (C&D) ADAR2 and FOXP1 showed higher expression in the atrial appendage than in the left ventricle (log10TPM 0.7). The expression of ADAR2 and FOXP1 is lower as compared to ADAR1. The whiskers represent the maximum and minimum values. The median is represented as a black line in the box. (E& F) Bar graph showing upregulation of ADAR1 p110 (ADAR1c) and p150 (ADAR1i) in different CHD cases. Both isoforms are significantly upregulated in ASD and VSD. This indicated that both ADAR1 isoforms have potential role in atrial heart tissue. However, a 3- to 4-fold increase in RNA levels was found in AVSD and TOF cases compared to controls. This implies that ADAR1 isoforms are upregulated in response to cardiovascular defects. The PDA cases did not show a significant difference from controls. The error bars indicate the mean +/-SD. *P < 0.05 (versus control), as determined by the Mann–Whitney U test. (G) Bar graph showing a strong decline in ADAR2 expression, particularly in AVSD, TOF and VSD, in CHD cases compared to controls. This indicated that ADAR2 might have a potential role in both heart atrium and ventricular tissue. ADAR2 is significantly downregulated in all CHD cases. Error bars indicate the mean +/-SD. *P < 0.05 (versus control), as determined by the Mann–Whitney U test. (H). Bar graph showing reduced expression of FOXP1 in all CHD cases signifying its importance in cardiovascular development. The strongest decrease was observed in the TOF samples. *P < 0.05 (versus control), as determined by the Mann–Whitney U test. The error bars indicate the mean +/-SD. (I). Heat map showing the normalized expression levels of ADAR1 p150 (ADAR1i), ADAR1 p110 (ADAR1c), ADAR2 and FOXP1 in different CHD cases compared to controls. The expression values are normalized with the housekeeping gene TUB1. The red color indicates increase in expression whereas the lighter red represents decrease in expression as compared to control.

