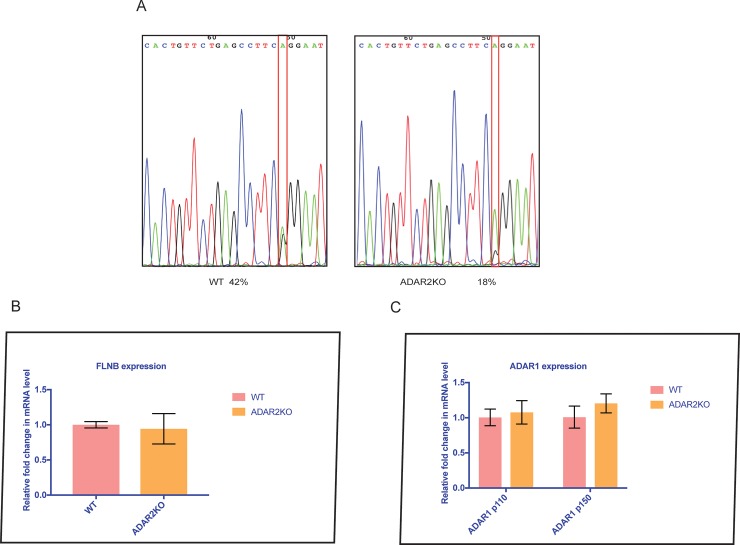
Fig 4. FLNB editing and ADAR1 expression in ADAR2-KO mice.
(A) Electropherogram showing a 24% decrease in editing in ADAR2-KO compared to WT mouse tissues. This indicated that FLNB is primarily edited at the Q/R site by ADAR2. (B) Expression analysis of FLNB. The impact of FLNB editing on its expression was evaluated by semi-quantitative real time PCR. The bar graph showed that there was no significant difference in the expression of FLNB in the hearts of ADAR2-/- mice compared to those of WT mice. This implies that editing of FLNB did not alter its expression. The error bars indicate the mean +/-SD. (C) ADAR1 isoform expression in ADAR2-/- mouse tissue. The upregulation of ADAR1 in CHD is either because of the absence of ADAR2 or CHD occurrence. Therefore expression of ADAR1 isoforms was determined in the ADAR2KO mouse heart tissues. The bar graph showed no significant difference in the expression of the ADAR1 isoforms (p110 and p150) in the hearts of ADAR2-KO mice compared to those of WT mice. This implies that the upregulation of ADAR1 is due to CHD. The error bars indicate the mean +/-SD.

