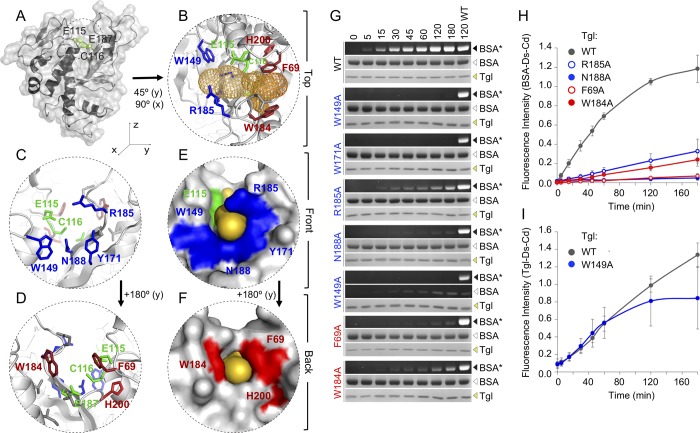
Fig 3. Residues at the front and back entrances of the Tgl tunnel are important for activity.
A: Cartoon and molecular surface representation of the structure of Tgl. The side chains and surface occupancy of the catalytic residues are shown in green. The active site of Tgl sits in a tunnel that traverses the molecule from side to [14]. B-F: Zoomed view of the tunnel region observed from the top (B), front (C, E) or back (D, F). In B and D secondary structure elements and side chains of relevant residues are shown, while in E and F only the surface of the molecule is represented. Relevant residues are highlighted in color: front (in blue), back (red), and catalytic residues (green). The free space of the tunnel is represented in orange, either as a mesh (B) or by surface occupancy (E, F). The models in A-F were drawn using the published structure of Tgl (PDB accession code 4P81). G: Tgl (WT type or mutant forms) was incubated at 50°C in the presence of BSA and dansylcadaverine (Ds-cd). Samples were taken at the indicated times (in min) and resolved by SDS-PAGE. The gels were exposed to UV light to reveal labeled BSA (BSA*), and then stained with Coomassie brilliant blue for the visualization of the amount of BSA and Tgl loaded. H: shows representative assays for the wild type (WT) enzyme and mutant forms with the indicated single Ala substitutions of residues in the front or back entrances of the Tgl tunnel. I: Quantification of the activity of TglW149A. Note that TglW149A did not label BSA, but showed auto-labeling activity (producing Tgl*). Thus, TglW149A shows an altered substrate specificity.In H and I, the fluorescence values obtained for BSA* (H) of for Tgl* (I) were normalized to the value obtained for the wild type enzyme after 120 min of reaction and plotted for all the assays where fluorescence could be detected (see also [14]).

