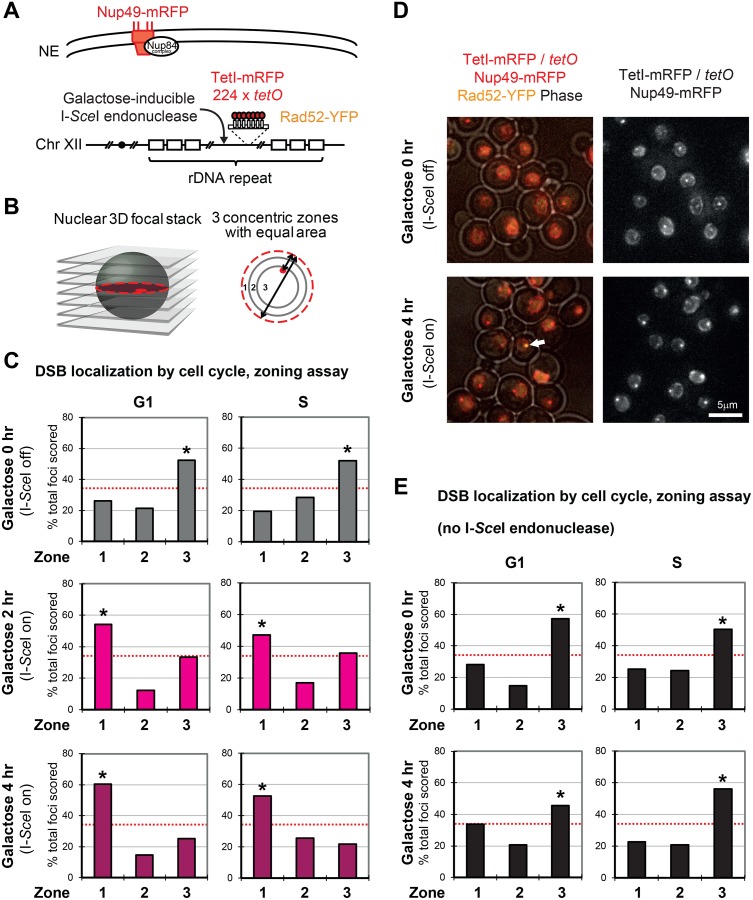
Fig 6. Localization of an I-SceI-induced DSB in the rDNA.
(A) Illustration of the inducible DSB in rDNA and its visualization. An I-SceI cut site and a tetO array were inserted into a site of the rDNA repeat [30]. TetI-mRFP and Nup49-mRFP label the position of I-SceI cut site and nuclear pores, respectively. (B) Locus position was scored relative to the nuclear diameter in the locus’ plane of focus using an image stack. Distance over diameter ratios were binned into 3 equal zones. (C) Position of cleaved I-SceI cut site in rDNA relative to Nup49-mRFP after 2 and 4 hours on galactose. The relocation to the nuclear periphery was observed in both G1 and S phase of wild-type cells. Although cleavage efficiency was calculated as 97% by real-time PCR, Rad52 positive cells were 20% of total cells at 4 hours after galactose addition (n = 285). For this reason, we scored the position of TetI-mRFP / tetO regardless of the presence or absence of Rad52 signal. Counted nuclei and statistical significance are indicated in S2C Table. (D) Representative images before and 4 hours after DSB induction are shown. The 3D stack images were projected to a 2D plane by standard deviation. The white arrow marks a Rad52-YFP focus colocalizing with TetI-mRFP signal on the cleaved rDNA. (E) Position of the I-SceI cut site in rDNA relative to Nup49-mRFP in the cells not expressing I-SceI. * = significantly non-random based on cell number and confidence values from a proportional test comparing random and experimental distributions. Red dotted line indicates 33% or random distribution.

