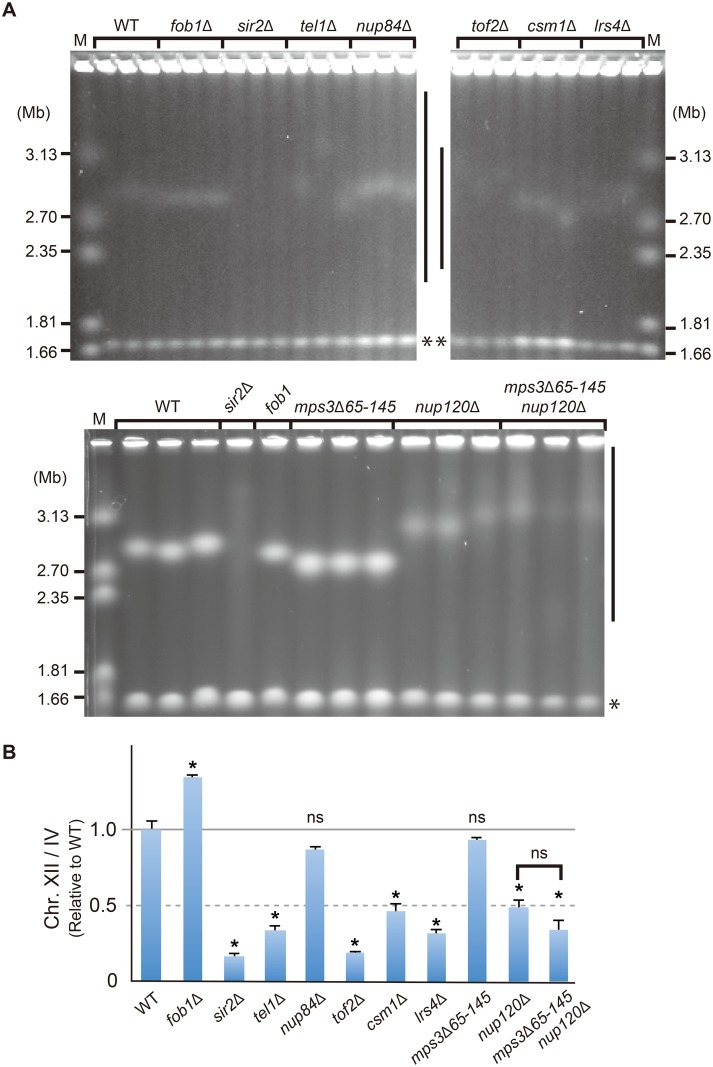
Fig 7. rDNA stability in rDNA-nuclear pore associations defective mutants.
(A) Pulse field gel electrophoresis was performed, and the gels were stained with ethidium bromide (EtBr) for visualization. The two largest chromosomes (XII and IV) are shown. Side bars and asterisks mark the position of chromosome XII and IV, respectively. M is the size marker (H. wingei chromosomes). (B) Quantitation of rDNA instability shown in A. Signal intensities were quantified as Fig 1C (see Materials and methods). The values are relative to that in the wild-type strain. Error bars show the standard error (SEM) of three independent colonies. The significance levels (* p < 0.05) are from the unpaired two-tailed t-tests. ns, not significant. P-values are shown in S2B Table.

