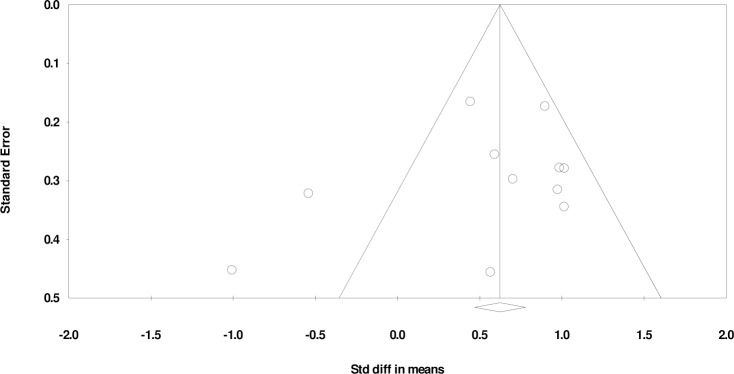
Fig 6. Funnel plot for error rate in visuospatial working memory, Egger’s linear regression P = 0.4.
SMD effect size plotted against standard error. The circles represent the studies in the analysis. The vertical line represents the population effect estimate and the diagonal lines represent the 95% confidence intervals.

