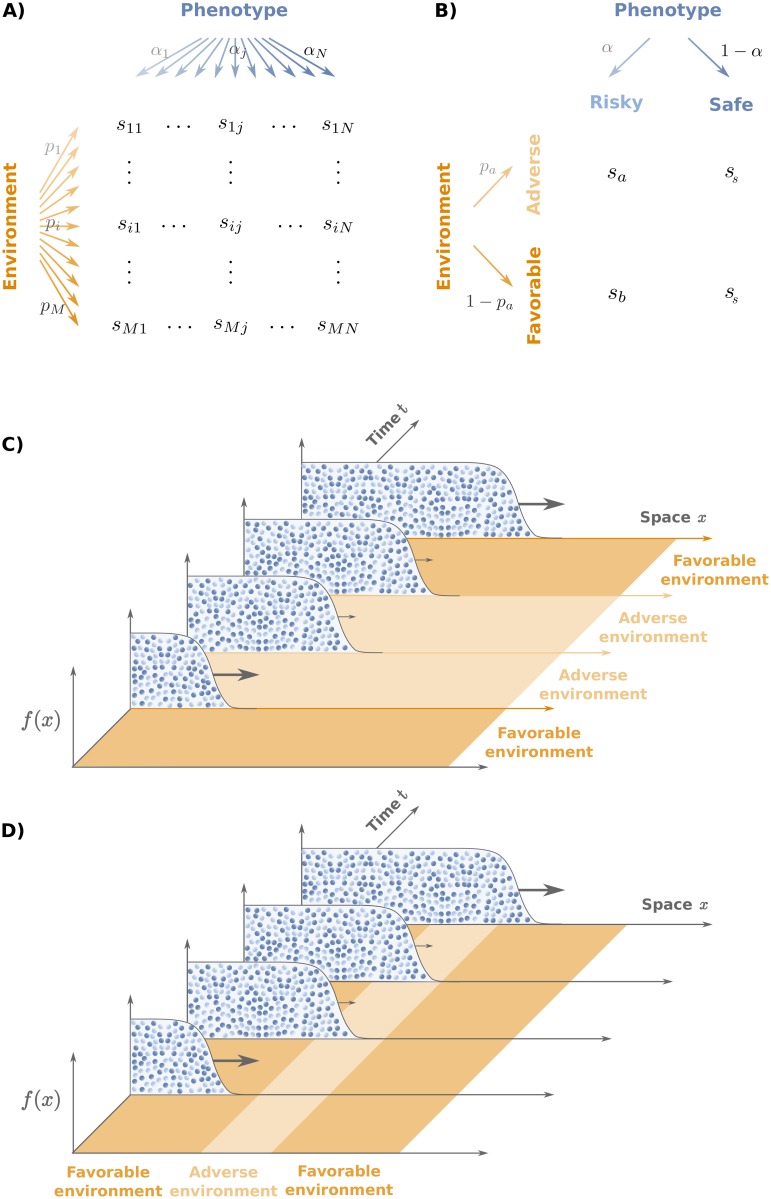
Fig 1. Population model.
A) General model: individuals can adopt N different phenotypes with probabilities αj (j = 1, ⋯, N) and experience M different environmental conditions with probabilities pi (i = 1, ⋯, M). The fitness of an individual with phenotype j in an environment i is given by sij. B) Two-phenotypes model: Individuals can adopt either a “risky” or a “safe” phenotype with probabilities α, and 1 − α respectively. The safe phenotype is characterized by an environment-independent growth rate ss. The growth rate of the risky phenotype is sa or sb, depending on whether the current environment is “adverse” (a) or “favorable” (b). C) and D) Sketch of range expansion in a population having 0 ≤ α ≤ 1 for temporally varying C) and spatially varying D) environments, respectively.

