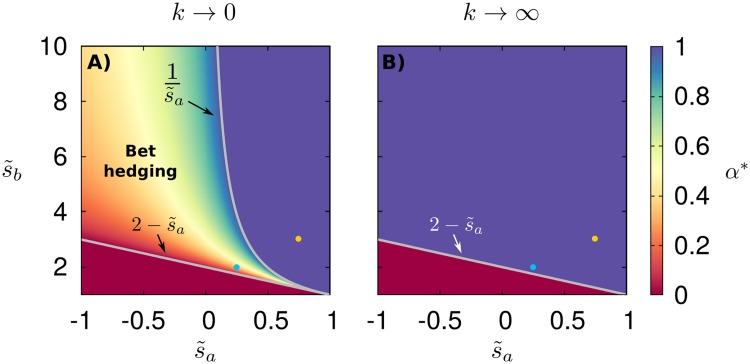
Fig 2. Bet-hedging region in temporally varying environments.
Optimal strategy α* as a function of growth rates and for range expansions in temporally varying environments under the limits of environmental change rate (A) k → 0, see Eq (7), and (B) k → ∞. In all panels, lines delimit the bet-hedging region 0 ≤ α* ≤ 1. Two dots in the panels mark parameter values chosen for the analysis of Figs 3, 4 and 5.

