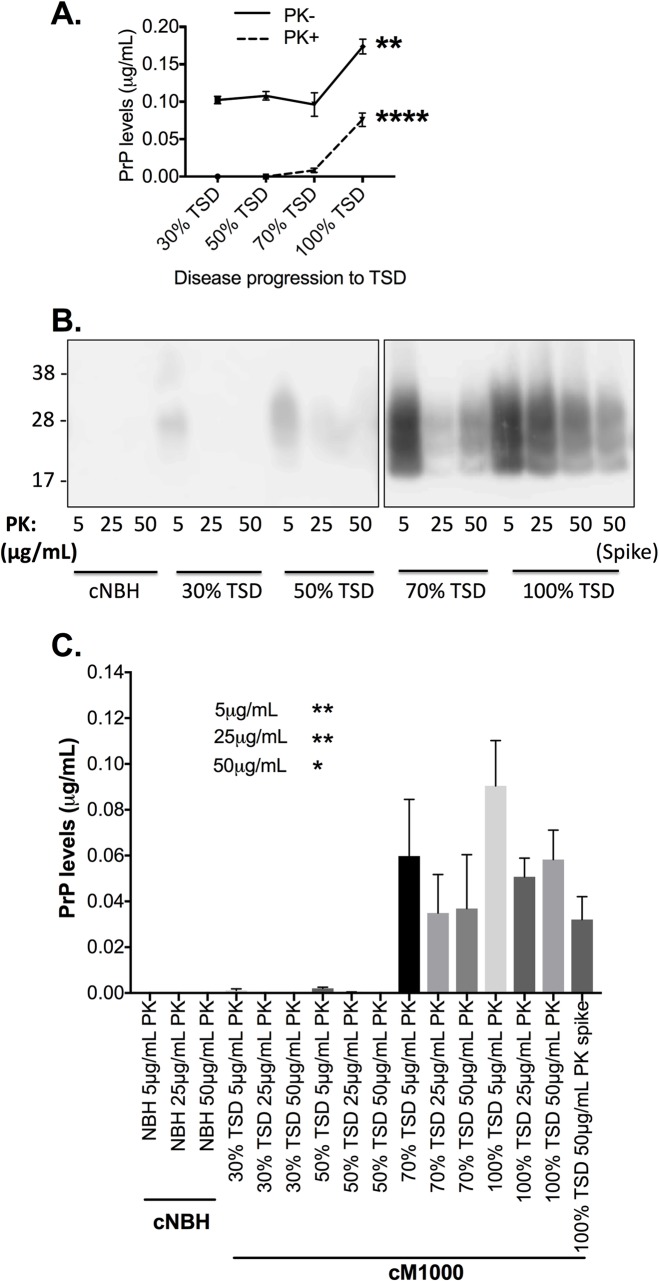
Fig 1. Levels of total PrP and proteinase K (PK)-resistant PrPSc species across the natural evolution of M1000 prion disease.
(A) Quantification of the immunoblots in S1A Fig with the levels of total PrP (without PK digestion: PK-) and at least modestly PK-resistant PrPSc (PK+) compared across M1000 disease evolution by One-way ANOVA with Tukey’s correction for multiple comparisons. (B) Western immunoblots of cNBH and cM1000 from all the disease time points following precipitation of PrPSc species by sodium phosphotungstic acid (NaPTA) and digestion with 5, 25, and 50 μg/mL PK (at 37°C for an hour), respectively. The “spike” represents the positive control demonstrating successful precipitation and detection of PrPSc species in 5μL of 10% (w/v) cM1000 that was spiked into 500μL of 1% (w/v) cNBH. (C) Approximate quantification of PrP levels (in μg/mL) in brain homogenates in B (n = 4). Results are presented as mean ± standard error of mean. *p<0.05, **p<0.01, ****p<0.0001.

