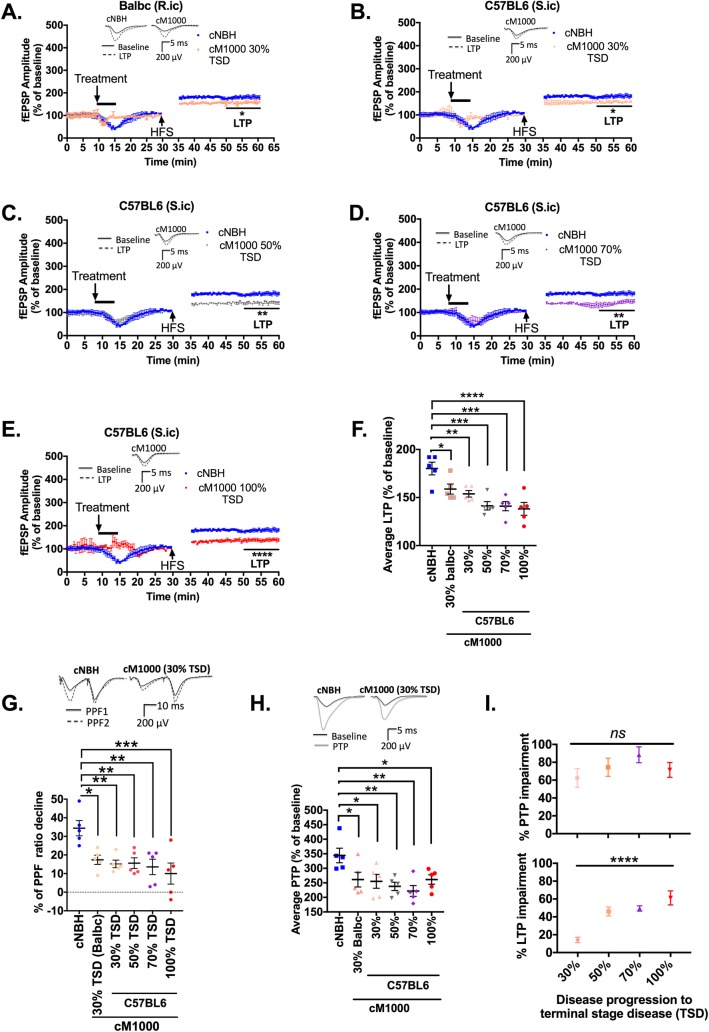
Fig 2. Synaptotoxic PrPSc species are propagated from early in the evolution of M1000 prion disease.
(A) CA1 region LTP of WT mouse hippocampal slices was significantly disrupted following a five minute exposure to 0.5% (w/v; in artificial CSF) crude M1000 brain homogenates (cM1000) derived from M1000 infected WT Balb/c mice (infected through routine intracerebral injection [R.ic]) at 30% of the incubation period to the terminal stage of disease (TSD). (B to E) CA1 region LTP of WT mouse hippocampal slices was significantly disrupted following a 5 minute exposure to 0.5% (w/v; in artificial CSF) cM1000 derived from M1000 infected WT C57BL/6J mice (infected by stereotaxic intracerebral injection [S.ic]) at 30% (B), 50% (C), 70% (D) and 100% (E) of the TSD. (F) Average LTP from the last 10 minutes of recordings (fEPSP readings following high frequency stimulation, HFS) after treatments with cM1000 from 30%, 50%, 70% and 100% of the TSD compared to the negative control 0.5% (w/v) crude normal brain homogenates (cNBH) derived from sham infected mice at the equivalent of 100% of the TSD. (G) Average percentage paired pulse facilitation (PPF) ratio decline following treatments in WT mouse hippocampal slices treated with cM1000 compared with cNBH controls as described in the Methods. (H) The average PTP generated by WT mouse hippocampal slices treated with cM1000 from across the disease evolution compared to the cNBH control as described in the Methods. (I) The percentage of PTP and LTP impairments (upper and lower panel, respectively) following treatments with cM1000 from each time point of the disease progression calculated as the percentage of PTP and LTP decrease compared to the normal PTP and LTP in slices treated with cNBH controls (One-way ANOVA with Tukey’s correction for multiple comparison). (A to E) The five minute treatments started after 8-to-10 minutes of stable baseline. The HFS trains were applied following 30 minutes of baseline recordings. (A, C, D) Results are presented as mean ± standard error of mean. (A-E, F, G & H) Average LTP/PTP/PPF ratio degree of decline in WT mouse hippocampal slices treated with cM1000 preparations from across the time points were compared with NBH controls by One-way ANOVA with Dunnett’s correction for multiple comparisons. (A-E, G & H) Some examples of raw fEPSP traces are provided as insets. *p<0.05, **p<0.01, ***p<0.001, ****p<0.0001, ns = not statistically significant (p>0.05).

